
Topics
-
Fifty-five women engineering students completed an AI bootcamp focused on rural Karnataka. Participants developed AI-based solutions after visiting villages and conducting field interviews. The She Innovates bootcamp partnered with several organizations to achieve its goals. This initiative aims to boost women's participation in AI and entrepreneurship. It encourages AI applications for rural development and community-focused sectors. View the full article
-
Besi's quarterly orders more than doubled, fueled by AI and hybrid bonding technology. The company saw increased customer adoption of its advanced chip packaging solutions. Demand for AI applications continues to drive growth in data centers. Besi anticipates revenue growth between ten and fifteen percent. This strong performance aligns with other semiconductor sector reports. View the full article


Leaderboard
-
Kiran Kumar Gadhamsetty
Members1Points10Posts -
Soji Sam
Members1Points10Posts


Popular Content
Showing content with the highest reputation on 09/09/2022 in Posts
-
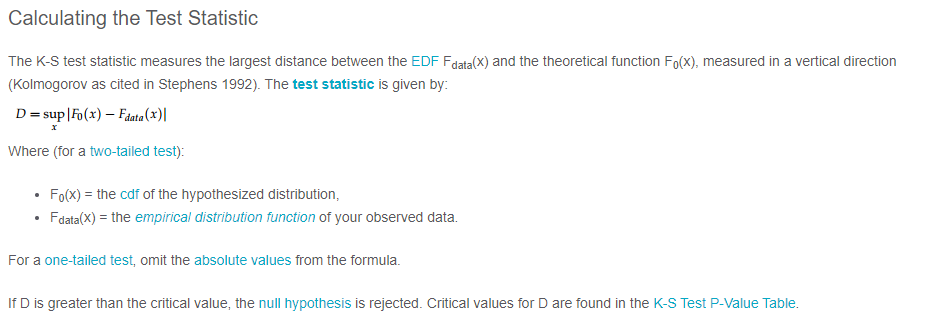
1 pointWhat is Normality Test - Normality tests determine whether or not a collection of data is distributed in a manner that is consistent with a normal distribution. They are often tests of a null hypothesis, that the data are chosen from a normal population. As a result, while it is possible to conclude definitively that a collection of data is not normally distributed (by rejecting the null hypothesis), the most that can be said if the null hypothesis is not rejected is that the data may conceivably originate from a normally distributed population. The primary tests for determining normality are Anderson Darling, Shapiro-Wilk, Kolmogorov-Smirnov and Chi Square. Here let's look into these tests in detail. Anderson Darling Test - The Anderson-Darling normality test is one of the universal normality tests that are meant to identify all deviations from normality. While it is commonly referred to be the most powerful test, no one test is superior to all others, and the other tests also have equivalent potency. When the p-value is less than or equal to 0.05, the test rejects the normality hypothesis. If the normality test fails, you may say with 95% certainty that the data does not fit the normal distribution. Passing the normality test merely permits you to say that there was no substantial deviation from normality. The AD test statistic is as follows: While the Anderson-Darling test has good theoretical features, it has a significant weakness when applied to real-world data. Ties in the data caused by low accuracy have a significant impact on the Anderson-Darling test. When there are a large number of ties, the Anderson-Darling will commonly reject the data as non-normal, regardless of how closely it fits the normal distribution. The data below was created using the normal distribution but was rounded to the closest 0.5 to create ties. A tie arises when the same value appears more than once in the data set: Shapiro-Wilks Normality Test - The Shapiro-Wilks normality test is one of the generic normality tests that are meant to identify all deviations from normality. Its power is equivalent to the other tests. When the p-value is less than or equal to 0.05, the test rejects the normality hypothesis. If the normality test fails, you may say with 95% certainty that the data does not fit the normal distribution. Passing the normality test merely permits you to say that there was no substantial deviation from normality. The Shapiro-Wilks test is not as affected by ties as the Anderson-Darling test, but is still affected. Kolmogorov-Smirnov Test - The Kolmogorov-Smirnov Test (K-S test) compares your data to a known distribution and indicates whether or not they have the same distribution. Although the test is nonparametric (it makes no assumptions about the underlying distribution), it is widely used as a normality test to determine whether your data is normally distributed. It is also used in Analysis of Variance to test the assumption of normality. More specifically, the test compares a known hypothetical probability distribution (e.g., the normal distribution) against the empirical distribution function created by your data. Chi Square Test - The Chi-Square Test for Normality determines if a model or hypothesis has an approximately normal distribution. The Chi-Square Test for Normality is not as effective as other more precise tests. Still, it's a quick and easy technique to verify for normalcy, especially when you have a distinct set of data points. To apply the Chi-Square Test for Normality to any data set, assume that your data is sampled from a normal distribution and use the Chi-Square Test. You must compute the anticipated values under the normal distribution for each data point given your mean and standard deviation. The formula is then used to calculate the chi-square statistic. When you have your degrees of freedom and desired alpha level, compare this to the crucial chi-square value from a chi-square table. If your chi-square statistic exceeds the table value, you may assume that your data is abnormal.
 1 point
 -
1 pointNormality test is a statistical hypothesis test used to determine if the sample has been drawn from a normally distributed population. Graphically, normal distribution resembles a bell with a symmetric distribution around the mean value. It is unimodal with mean, median & mode being equal. Commonly used tests for normality are Anderson Darling, Shapiro-Wilk, Kolmogorov-Smirnov & Chi Square. Shapiro-Wilk test is sensitive to sample size. It is generally used for sample sizes less than 50. For larger sample sizes, the result is always statistically significant. Kolmogorov-Smirnov is generally used for sample sizes greater than 50. It doesn't requires to know the underlying distribution of the population before running the test. It requires us to enter location, scale and shape parameters for running the test. It can't be used for discrete distributions. Anderson Darling is a modification to Kolmogorov-Smirnov test with more weight to the tails than Kolmogorov-Smirnov test. It doesn't has a good power as that of Shapiro-Wilk test but offers better power than other tests. Chi Square normality used when the sample has discrete set of data points. It is used when the expected value of number of sample of observations is greater than 5. The data must be randomly extracted and the variable of study is categorical.1 point
This leaderboard is set to Kolkata/GMT+05:30