
Topics
-
Jeff Bezos is pushing Prime Video's overhaul to highlight Amazon's AI. The project, known as Lighthouse, aims to showcase AI for millions of users. This initiative seeks to elevate Amazon's standing in the competitive AI landscape. New features will improve content recommendations and respond to spoken requests. Bezos' personal involvement underscores the strategic importance of this AI integration. View the full article
-
Advanced Micro Devices is launching new artificial intelligence hardware on Thursday. This new hardware aims to compete directly with Nvidia's offerings. AMD is targeting the growing data center inference computing market. The company also announced significant deals with AI labs Anthropic and OpenAI. These agreements position AMD for substantial future revenue in the chip sector. View the full article


Leaderboard
-
Vishwadeep Khatri
Administrators2Points6,727Posts -
P Balakumaaran
Members2Points13Posts -
Mayank Gupta
Members1Points679Posts -
Patankar Sanjay
Members1Points1Posts


Popular Content
Showing content with the highest reputation on 05/27/2022 in Posts
-
1 pointQ 475. Refer to process maturity discuss earlier - https://www.benchmarksixsigma.com/forum/topic/34912-process-maturity/ Does success with DMAIC relate with process maturity? Which of the following thoughts will you like to support and why? 1. A process with higher maturity provides lesser opportunities for DMAIC. 2. A mature process open doors for many rapid DMAIC sequences. Note for website visitors - Two questions are asked every week on this platform. One on Tuesday and the other on Friday. All questions so far can be seen here - https://www.benchmarksixsigma.com/forum/lean-six-sigma-business-excellence-questions/ Please visit the forum home page at https://www.benchmarksixsigma.com/forum/ to respond to the latest question open till the next Tuesday/ Friday evening 5 PM as per Indian Standard Time. Questions launched on Tuesdays are open till Friday and questions launched on Friday are open till Tuesday. When you respond to this question, your answer will not be visible till it is reviewed. Only non-plagiarised (plagiarism below 5-10%) responses will be approved. If you have doubts about plagiarism, please check your answer with a plagiarism checker tool like https://smallseotools.com/plagiarism-checker/ before submitting. The best answer is always shown at the top among responses and the author finds honorable mention in our Business Excellence dictionary at https://www.benchmarksixsigma.com/forum/business-excellence-dictionary-glossary/ along with the related term1 point
-
1 pointQ 474. A famous quote says - "Customers don't feel Averages". Still a lot of our metrics focus on average performance - Average Handling time, Average Defects etc. If not averages, then what does the customer actually feel? How can we improve the performance metrics to reflect the actual feelings of the customers? Provide examples to support your answer. Note for website visitors - Two questions are asked every week on this platform. One on Tuesday and the other on Friday. All questions so far can be seen here - https://www.benchmarksixsigma.com/forum/lean-six-sigma-business-excellence-questions/ Please visit the forum home page at https://www.benchmarksixsigma.com/forum/ to respond to the latest question open till the next Tuesday/ Friday evening 5 PM as per Indian Standard Time. Questions launched on Tuesdays are open till Friday and questions launched on Friday are open till Tuesday. When you respond to this question, your answer will not be visible till it is reviewed. Only non-plagiarised (plagiarism below 5-10%) responses will be approved. If you have doubts about plagiarism, please check your answer with a plagiarism checker tool like https://smallseotools.com/plagiarism-checker/ before submitting. The best answer is always shown at the top among responses and the author finds honorable mention in our Business Excellence dictionary at https://www.benchmarksixsigma.com/forum/business-excellence-dictionary-glossary/ along with the related term1 point
-
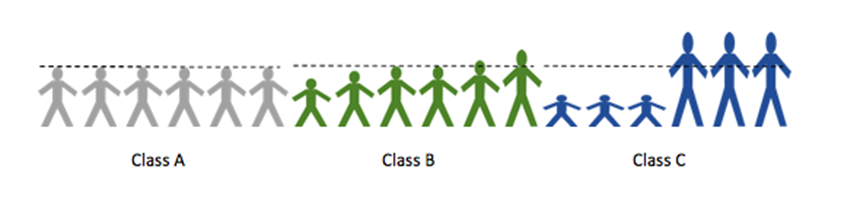
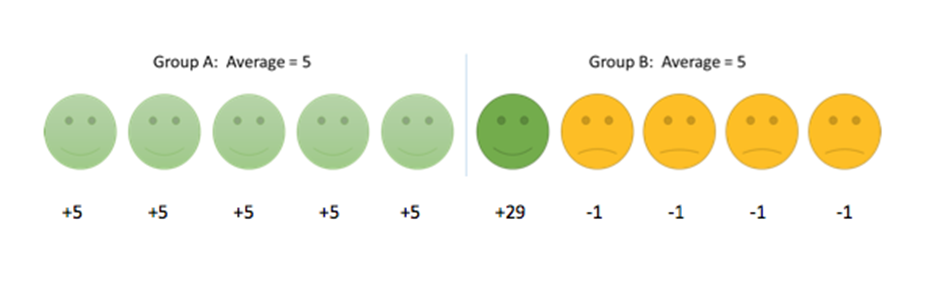
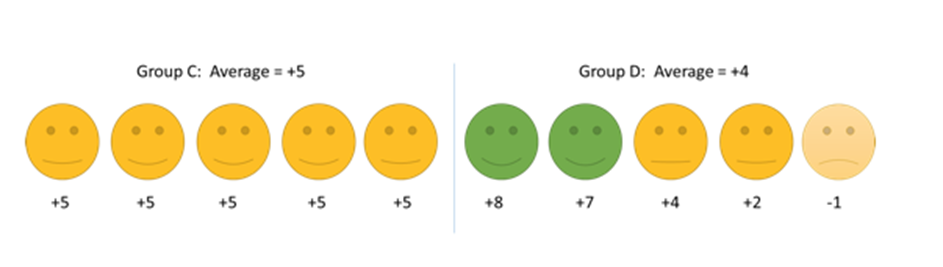
1 pointThe reporting metrics from many of the organizations are not descriptive in nature. We may have noticed that the most of those metrics are based on averages or sometimes median value. The average may be misleading because of uneven spread in the results or uncertainty about whether patients had an important improvement. Some of the problems with averages are as below: 1. The mean does not show the spread of data For example, if we want to look at the height of the students in a class, the average height is the same in classes A, B and C below but the individual students height are different. 2. The spread of data may not be even In the above example, the data are spread evenly above and below the average. However, this is not always the case. One person’s data can have a large effect on the average of the whole group. For example, we ask patients to rate their pain on a 0-100 scale and the results are: Group A: For 99 people, pain reduced by 10 points; for 1 person, pain reduced by 50 points. Group B: For 99 people, pain reduced by 10 points; for 1 person, pain increased by 50 points. The average is a 10.4 point improvement in group A and a 9.4 improvement in group B. Based on the average, the treatment in group A looks better but, in reality, for 99% of people, both treatments are equally effective. In this case, the mean is misleading since two people with extreme results are pulling the average up or down, so it does not represent the population as a whole. This is what will happen when there is a ‘skewed’ distribution because of extreme outliers. In a similar way, two groups can have the same mean result, even though most participants do better on treatment A but there is just one patient who does really well on treatment B, as in the example below. 3. The mean does not show how many people had a significant improvement Another way in which the mean can be misleading is that it does not give us information about how a patient’s improvement relates to whether they had an significant change. Sometimes this change is referred to as the minimum significant difference. From the example below, the average of group C seems better than group D since they improved by 5 points on average compared to 4 points in group D. However, if a minimum 7 point change is needed to be significant in the patient, no patient in group C experienced a significant change but 2 people in group D did. In terms of the proportion of patients who have a significant improvement, group D is better than group C. The average in this example is misleading as it does not show which patients have an significant change. When the average is higher in one group, it does not mean that the treatment was better for the other group, since most patients do not experience the ‘average effect’. Averages are meant to be a measurement across a diverse group of samples. The main purpose of averages is to measure changes over time in the same sample group. Three common errors that can happen by following only the averages : 1) Any data set will have outliers. These outliers tend to skew the average of the dataset to “pull” it in their direction. 2) Many people tend to think of “average” as “typical”, the problem with that assumption is that, there are many, exceptions to “typical.” For example, the average obesity rate in the United States, which is often cited as “about 50%.” If one researches the question, they will discover average obesity rates vary widely based on factors such as age, level of educational, profession, genetics, etc. As such, everyone is categorized differently by these factors resulting in many different average obesity rates depending on which factors describe those being measured. 3) Averages of often wrongly used is in characterizing individual scenarios. It is statistical err to apply the average of a group of data points to a single point and expect it to be true. Even assuming data as normally distributed, the probability that any one data point will be the same as the average is 50% — the same as a random guess. Solution: The problem is “Customers do not feel the average — they feel the variation”. The in-depth view of the business is based on average based measures of our performance. Customers don’t weigh us on averages, they feel the variance in each performance, service, each product, each interaction we have on the phone, each correspondence we have through email or a letter, and every other process that touches the customer in one way or other — online or offline. Customers expect a consistent, predictable business processes that deliver world-class levels of quality. They feel the difference, not the average. A few examples For qualitative measures, the feel, Visual, taste, smell et., of a product, we do not think in terms of an “average”. Instead, the customers weigh them by relative measures and the difference between them. For Example , 1) “the coffee from Cloudbucks tasted better than that from Coffeenight, (or) the perfume Wildrock smells good compared to the Axel perfume.” The customers feel the difference, not the average. That’s the reason we define Quality based on Customer’s perception. For quantitative measures, variation and not the average, that works well. The customers tend to perceive the variation from the previous event. For Example, 1) ”The last time I ordered from EKart, I received that package in 3 business days; but, on other times I receive my order usually after 6 days on standard shipping” Ekart may calculate and report their average lead time as 3 days which may not account the instances when the lead time were more than 3 days (dissatisfied customer) and those events when it was less than 3 days (happy customer). 2) ”Yesterday when I went to PizzaHouse during lunch hour, I was in and out of there within 30 minutes, but on other days I’m there for my whole lunch hour” PizzaHouse may advertise as their average service time as 30min, which may not account those events when it went >30 min (dissatisfied customer) & those events when it was <30 min (happy customer). In general, the organizations that report averages, are not concerned about both happy customer and the Dissatisfied customer. They only race towards the average customer satisfaction. “On average, our customers are 90% satisfied”- a popular tagline by some businesses and organizations. If I have a bad experience with a vendor, I don’t cognitively step back and think that I have been a customer for this vendor during last 10 instances, and I had only one bad experience, so far, so on average I’m 90% satisfied. Customers experience good or bad, as it is and their future behavior, purchases and recommendations are shaped by these experiences. To further add to it, cognitive biases such as negative and recency bias often interject and give disproportionate weight to these positive or negative experiences, reinforcing them and the resulting behavior that follows it. In probability theory and statistics, the coefficient of variation (CV), also known as relative standard deviation (RSD),[citation needed] is a standardized measure of dispersion of a probability distribution or frequency distribution. It is often expressed as a percentage, and is defined as the ratio of the standard deviation to the mean (or its absolute value. The CV or RSD is widely used in analytical chemistry to express the precision and repeatability of an assay. It is also commonly used in fields such as engineering or physics when doing quality assurance studies and ANOVA gauge R&R. In addition, CV is utilized by economists and investors in economic models. It shows the extent of variability in relation to the mean of the population. The coefficient of variation should be computed only for data measured on scales that have a meaningful zero (ratio scale) and hence allow relative comparison of two measurements (i.e., division of one measurement by the other). The coefficient of variation may not have any meaning for data on an interval scale. Hence Standard Deviation, Variance and Co-efficient of Variation are some of the alternatives to the averages, while presenting the performance to the Customers.
 1 point
 -
1 pointThis seemingly simple question has proved to be very challenging. The statement - "Sigma Level for a process cannot be calculated if there are zero defects" - is only true for Discrete Data. This statement does not hold good for Continuous Data. For Continuous Data, Sigma Level can be calculated (without knowing the actual defect count) and it indicates the probability of getting defects (DPMO). For Discrete Data, we first calculate DPMO / DPU / Yield% (with the actual defect count) and then convert them to Sigma Level. Hence, if defects are 0, there is no Sigma Level for Discrete Data. While there are a few answers which seemed to be moving in the right direction, however no answer is completely correct. Hence, there are no winners for this question.1 point
-
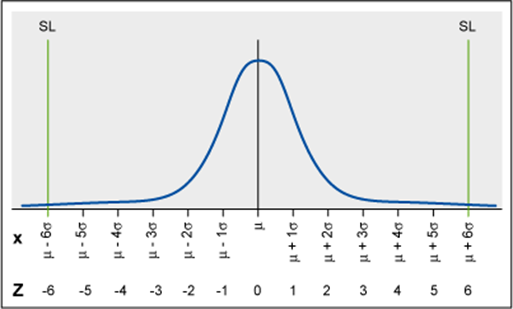
1 pointSix Sigma is a data driven approach which aims at reducing the variation in a process. As per the Measure of Central Tendency, mean and SD are the 2 important parameters that helps to characterize a process. Mean helps to define how far the process is performing from the specification (target), whereas Standard Deviation helps to define the Spread or Variation in the proces. In general, we assume that the process data is normally distributed. From the Normal distribution curve, the distance between the Process mean and the Specification mean can be measured by counting the number of Standard deviations between them, which is denoted by Z (Sigma level). A 6-Sigma process has the specification limits which are 6 standard deviations from the specification mean (as shown below). In a process, any value that lies between the Specification mean and the Specification Limits (USL & LSL), is called a defect. Sigma level can be calculated for both the continuous data and Discrete data available from the process. Continuous Data – anything that can be measured. Eg – Weight, Length, Diameter, Temperature etc. Discrete Data – anything that can be counted or classified. Eg – number of products, number of samples, number of pallets, Classification of Good products & defective products etc. Sigma Calculation for Continuous Data: To calculate the Sigma Level for Continuous data, we need to calculate the CpK. CpK = Min [(USL-Xbar)/3σ, (Xbar-LSL)/3σ] Process Sigma = 3 * CpK Example: Specification Mean = 50 mm Upper Specification Limit = 50.1 mm Lower Specification Limit – 49.8 mm Standard Deviation = 0.02 mm CpK = Min [(50.1-50)/(3*0.02), (50-49.8)/(3*0.02)] CpK = Min [1.67,3.33] CpK = 1.67 Process Sigma Level = 3*1.67 = 5 Conclusion: If the number of defects are Zero means, all the measured values are falling within the specification limits. But that doesn’t mean that the Process mean is equal to Specification mean. The normal curve which we draw for the continuous data is an asymptote – which never touches the X-axis and the area of the curve can never be 100%. Hence it is not possible to calculate the Sigma level for zero defects , in other words, it is practically not a feasible situation to get zero defects, even in a stable and consistent process. Sigma Level Calculation for Discrete Data: In order to calculate the Sigma Level, the following steps can be followed: 1) Define the number of Opportunities (O) – which is the number of lowest defects noticeable by the customer 2) Define the number of Defects (D) - which is the number of values that deviate the specification limits in actual 3) Calculate Yield = [(D)/((U)*(O))] 4) Look up for the Sigma Level from the Yield to Sigma Conversion Table. Example: # Opportunities = 10 # Defects = 5 # Units = 4 DPO = 5/(10*4) = 0.125 DPMO = DPO *1000000 = 0.125*1000000 = 125000 From the chart, we can find the Sigma level = 2.65 We can also calculate the sigma level in excel using the formula below: Sigma Level = -NORMSINV(DPO)+1.5 Sigma level = -NORMSINV(0.125)+1.5 = 2.65 Note : This formula accommodates the 1.5 Sigma shift that happens in any stable process over a longer term. In this case, lets assume that, number of defects as Zero. # Opportunities = 10 # Defects = 0 # Units = 4 DPO = 0/(4*10) = 0 DPMO = DPO * 1000000 = 0 Conclusion: This usually happens when we collect samples over a shorter period of time or sometime when the samples are biased. This will give a false indication that the process is very good. In fact, this is only possible because we did not have a sufficient sample size. Hence Sigma level cannot be calculated for a process with Zero defects or in other words, zero defect process doesn’t exist on a longer time period and we need to collect sufficient sample size.

 1 point
 -
1 pointYes. It is true .Sigma level for a process can not be calculated if there are ZERO defect. For Discrete data & Continuous data Suppose example of 100 units ,There are ZERO defectives. The Yield will be 100 %. Sigma level overall will be Infinity Hence Sigma level for a process can not be calculated1 point
This leaderboard is set to Kolkata/GMT+05:30