
Topics
-
Fifty-five women engineering students completed an AI bootcamp focused on rural Karnataka. Participants developed AI-based solutions after visiting villages and conducting field interviews. The She Innovates bootcamp partnered with several organizations to achieve its goals. This initiative aims to boost women's participation in AI and entrepreneurship. It encourages AI applications for rural development and community-focused sectors. View the full article
-
Besi's quarterly orders more than doubled, fueled by AI and hybrid bonding technology. The company saw increased customer adoption of its advanced chip packaging solutions. Demand for AI applications continues to drive growth in data centers. Besi anticipates revenue growth between ten and fifteen percent. This strong performance aligns with other semiconductor sector reports. View the full article


Leaderboard
-
Mokshesh
Members1Points10Posts

Popular Content
Showing content with the highest reputation on 09/08/2021 in Posts
-
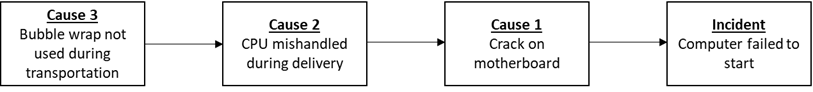
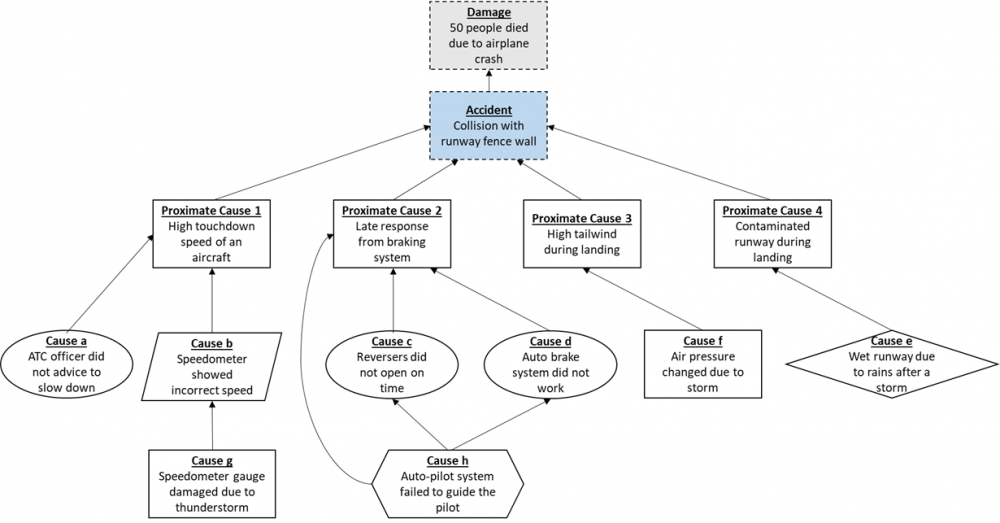
1 pointQ) Why Because Analysis (WBA) is a variation of 5 Why analysis which is particularly useful in accident causal analysis. Explain WBA along with its output Why Because Graph (WBG) with an example. Answer: What is a ‘Why Because Analysis’ (WBA): Accident causal analysis (or incident investigation analysis) is a type of posterior analysis which uses inductive reasoning to develop a theory which can give a satisfactory causal explanation of the accident (incident) being analysed. Causal analysis is one of the many methods available for performing accident (incident) analysis. With modern engineering, humans are able to build advanced systems that can fulfil a complex task. However with the advent of sophisticated systems, it has become intellectually difficult to do the failure analysis of complex systems using traditional causal analysis method. Let’s understand this with an example. Suppose that there is a standalone computer (a simple system) which has failed to start. A causal analysis using conventional ‘5 Why’ analysis method could be something like as shown below. The above causal chain shows a simple cause-effect relationship which may be sufficient for simple incidents. But suppose that the computer is part of a complex network, with connection to other computers, servers, internet, external devices, human operators and changing environment. In such a situation if a computer shuts down suddenly while operating then it becomes difficult to do an incident analysis with a simple cause-effect relationship. Complex systems show a complex cause and effect relationship and requires a more rigorous approach to causality. One has to not only assess the individual components, but also the interactions between them. What adds to the difficulty is that, at times, many complex system failures have been observed even without the breakdown of individual components of a system. Why-Because Analysis (WBA) as an alternative causal analysis method was therefore developed by Everett Palmer, a research engineer at NASA Ames Research Centre (California) to perform the failure analysis of such complex, open and heterogeneous system. The term ‘open’ means that the system’s behaviour is highly affected by the environment in which it is operating and ‘heterogeneous’ means that system has many components that must work together for entire system to function smoothly. In fact, Everett Palmer made the Why-Because Graph (WBG) first which led to development of WBA then. Understanding a ‘Why-Because Graph’ (WBG): Accident analysts use a Why-Because Graph (WBG) to map the complex cause and effect relationships. WBG is essentially a directed acyclic (non-circular) graph to respect the laws of causality. Let us understand some concepts & terms to be able to make a WBG for an accident analysis. 1. Counterfactual Test (CT): WBA uses a rigorous notion of causality known as counterfactuals. British empiricist David Hume in his theory of causation propounded the counterfactual test. He argued that two occurrences are causally related as cause and effect if they pass this test. Test: X is a cause for Y, if and only if, had X not occurred, Y could not have occurred. To apply this test, ask this question: If X had not happened, could Y had happened? If the answer is ‘No’, then X becomes the necessary causal factor (NCF) for Y to happen. If the answer is ‘Yes’ the X is not necessary for Y to happen. Y would have happened anyway. Here importantly, we must understand that while X is a necessary factor for Y to happen, it alone may not be sufficient for Y to occur. This brings us to our next concept as follows. 2. Causal Sufficiency Test (CST): In CST, the objective is to decide whether a group of causes are sufficient for an effect to happen. Test: X1, X2, X3…..Xn are causally sufficient for effect Y to happen, if and only if, Y inevitably happens when X1, X2, X3…..Xn happens. Summing up both the above tests, one can say that the group of causes under consideration creates an effect only when both CT and CST are positive. A positive CT indicates that each cause is necessary and a positive CST indicates that all listed causes are sufficient for an incident to occur. 3. Accident: An accident is an occurrence that results in a significant loss and is within our area of interest. Let’s represent this with a blue dotted line rectangular box. 4. Damage: The loss occurred as an outcome of an accident is termed as damage. Let’s represent this with a grey dotted line rectangular box. 5. Factors: Factors are the set of causes that are considered to be responsible for an accident and the resultant damage. Factors can be broadly classified as Events, Process, Un-Event, State and Assumption. Let’s understand these briefly: a. Events: Events are simply the changes that have happened in the system. Ex: In a car as a system, if the speed changes from 50 km/hr to 60 km/hr, then this acceleration is called as an event. Let’s denoted it by a rectangular box. b. Process: They are sequence of similar events. Ex: If a car increases its speed incrementally from 50km/hr to 51 to 52….60km/hr, then this sequence of similar events is called as a process. Let’s denote it by a parallelogram. c. Un-Event: An un-event is an event that should have happened, but did not. Ex: A car crossing a red signal is an event. But if you carefully think over it, then it is an un-event. Let’s denote this with an oval. d. State: State is a condition that is true across the events and process. Ex: A car must stop before the red signal is a condition that is true over the various events and processes. Let’s denote this as by a diamond shape. e. Assumption: These are factors that do not have enough evidence to support a cause but are important as a part of causal sufficiency test. In an on-going investigation, these assumptions are loose ends which can be resolved as a real factor as investigation progresses. Let’s denote this by a hexagon shape. f. Proximate Causes: All those factors that immediately precede the accident are termed as proximate causes. These factors are primarily some events or processes as explained above. Now let’s understand an example of WBG using above terms and concepts that we learnt. (Below WBG is a simple diagram for learning perspective and does not indicate complete analysis of any real investigation) Let’s assume that each cause (factor) in the above WBG has passed the counterfactual test (CT) as we move from bottom most factor to the accident node. Also, let’s assume that all these factors have passed the causal sufficiency test (CST). One can now say that above WBG is a complete representation of cause and effect analysis behind failure of a complex system. What follows after any cause and effect analysis is the finding of countermeasures to avoid occurrence of these set of causes to avoid the future accident and damages. In an advanced WBG practice, the analysts also place the countermeasures as one of the factors to check if they are efficient enough to avoid various factors, especially the un-events.
 1 point

This leaderboard is set to Kolkata/GMT+05:30