

vishwadeepak.choudhary26
Members
-
Joined
-
Last visited
Everything posted by vishwadeepak.choudhary26
-
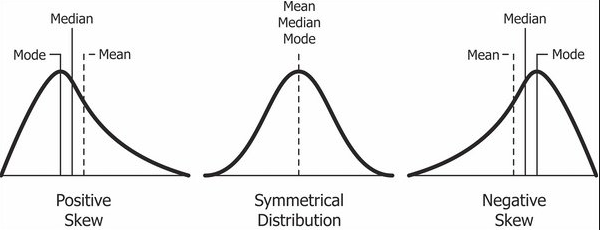
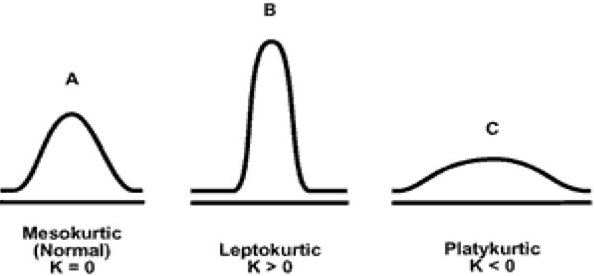
vishwadeepak.choudhary26 replied to Vishwadeep Khatri's topic in We ask and you answer! The best answer wins!Skewness and Kurtosis – the shape parameters (we can also call them tail parameters as both describe the tails of the distribution), as they are called so do they do. Skewness is the measure of the symmetry of the distribution or more precisely the lack of symmetry of the distribution. If your distribution is completely symmetrical, then you should get Skewness statistic as zero when you run the descriptive analysis. Skewness is also stated as a comparative measurement of the two tails of the distribution, if they are same the Skewness value would be zero. Below picture exemplifies Symmetric (in the center) and asymmetric (left and right) distributions. If your data is skewed towards the right, then it is called positive Skewness and if it is skewed towards left, then it is called negative Skewness. So now, when your statistical software throws a (–ve) or (+ve) number, you know what it is. We all know that normal (bell curve) distribution is symmetric so the Skewness parameter for a normal distribution is zero. Let’s talk about Kurtosis. In the beginning, it was understood as a measure of peakedness of the distribution but this was later proven not to be correct. There does exist some correlation between Kurtosis and peakedness but more research is required to comment further on the relationship. Kurtosis gives us the combined weight of the tails as compared to the weight of the remaining part of the distribution. A normal distribution would have a Kurtosis parameter of 3. Many software packages throw another output for Kurtosis which is called Excess Kurtosis. Excess Kurtosis is the relative Kurtosis from a normal distribution thus excess Kurtosis for a normal distribution is zero. We have three more little terrifying terms here: Platykurtic, Mesokurtic and Leptokurtic. Platykurtic distribution is with excess Kurtosis of less than zero (-ve), Mesokurtic distribution is with excess Kurtosis of zero (0) and Leptokurtic distributions is with excess Kurtosis of more than zero (+ve). Refer to below image: We would talk about the usage of these two parameters now. As explained above, these definitely help us to know about the shapes of the distribution; more importantly whether we are working with normal distribution or not. However, these parameters are highly sensitive to the sample size that we are working on and changes drastically when the sample size is increased or decreased (as they are third and fourth standardized central moment of the model in analysis whereas standard deviation is only second standardized central moment). Thus, it’s difficult to rely on these statistics (or parameters). You can always deduce information about the shape of the distribution through your mean (location) and standard deviation (dispersion) summaries. I would like to re-iterate what Dr. Donald J. Wheeler mentions on these parameters: "In short, skewness and kurtosis are practically worthless. Shewhart made this observation in his first book. The statistics for skewness and kurtosis simply do not provide any useful information beyond that already given by the measures of location and dispersion." As a conclusion, there appears very little reason why we should bother about the Skewness and Kurtosis parameters. The histogram, location, and dispersion should be able to help us with the information that we need.
-
vishwadeepak.choudhary26 replied to Vishwadeep Khatri's topic in We ask and you answer! The best answer wins!A deep intrinsic problem with FMEA is how we calculate RPN (Risk priority number) by performing a mathematical operation on three ordinal scale data. Severity, occurrence and detection are purely ranked numbers and we never get to see the absolute difference between two ranks so any mathematical operation like addition, subtraction or multiplication don’t hold true however they can definitely throw a mathematical number. We calculate RPN in the similar fashion and then use this number to prioritize risks. Moreover, three building blocks of RPN are not on the same scale. They have different priorities in different organization. Severity should definitely be considered of top most importance. Let’s look at a scenario. We will try to calculation RPN for two earthquakes with different magnitudes. One at Richter scale of 2.0 and another at 6.0. 1. Richter scale 2.0 earthquake: Severity = 2 (as per Richter scale reading) Occurrence = 5 (assuming that this occurs very often) Detection = 4 (we would use same detection for both scenarios) RPN = 2 * 5 * 4 = 40 2. Richter scale 6.0 earthquake: Severity = 6 (as per Richter scale reading) Occurrence = 1 (very less frequent) Detection = 4 (we would use same detection for both scenarios) RPN = 6* 1 * 4 = 24 If we simply go by prioritizing risks as per RPN, then the first risk would get prioritized however practically that’s a lot safer than Risk 2. Richter scale 6.0 earthquake is rare but if it occurs for once, it’s a disaster. The RPN calculation doesn’t take care of such individuality which makes a great sense in practical scenarios. One way to overcome above problem could be to use weighted count method for calculating RPN. Severity should get highest weightage (may be 3), followed by Occurrence (may be 2) and then Detection (may be 1). Let’s redo the above earthquake scenario and we would call our metric as Weighted Ordinal RPN (WO-RPN). 1. Richter scale 2.0 earthquake: Severity = 2 (as per Richter scale reading) – we would consider it as count 2 and multiply it by weightage 3: gives the value of 6 Occurrence = 5 (assumption that this occurs very often) – Weightage 2, so count gives 2*5 = 10 Detection = 4 (we would use same detection for both scenarios) – Weightage 1, so count gives 1*4 = 4 WO-RPN = 6+10+4 = 20 2. Richter scale 6.0 earthquake: Severity = 6 (as per Richter scale reading) – Weightage 3, count = 3*6 = 18 Occurrence = 1 (very less frequent) – Weightage 2, count = 1*2 = 2 Detection = 4 (we would use same detection for both scenarios), Weightage 1, count = 4*1 = 4 WO-RPN = 18+2+4 = 24 And this weighted ordinal RPN brings second risk as top priority which is the cause of the concern. I welcome your thoughts on this subject further.
-
There isn't one word answer to this and a call is required basis the job expectation and organizational structure. I am voting Against this considering a scenario where there is a Master black belt in the organization and Black belt is in individual contributor role and expected to devote 80% and more time into project delivery. The important aspect in such a role is the knowledge of the framework and application of various tools in differing scenarios. As long as candidate is able to proof himself on these criteria, he can be hired as there would ample resources and people around him to coach while he takes up his first project to closure (if he is stuck somewhere). Rather than only completion of a DMAIC project, more valuable assets to look for would be curiosity, questioning abilities, thinking-out-of-box and project management skills which are mandate to be successful in such roles. However when organizational structure is flat and there is only one Black belt (or company is trying to establish the process improvement function with hiring the black belt) , it's definitely vital to look for people who would have completed one or many projects using DMAIC/DMADV otherwise there could be impact on how organization reaps the value in CI journey on the wheel of Six Sigma as he would be whole sole owner of the function and there's definitely a larger responsibility.
-
This story is really amazing which strengthens our changing nature. Indeed we should question our habits, we can find much room for improvement.