Himanshu.Sharma
Members
-
Joined
-
Last visited
Everything posted by Himanshu.Sharma
-
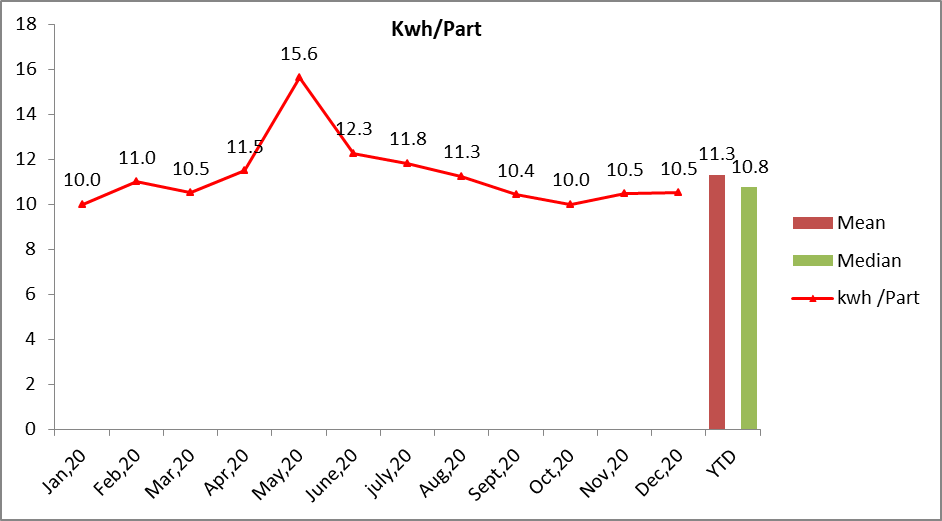
Himanshu.Sharma replied to Vishwadeep Khatri's topic in We ask and you answer! The best answer wins!Mean & Median: Mean Median used to measure central tendency of data. The arithmetic mean is found by adding set of value and dividing by no of values in a data set. Median is centre value of data when data arranged in ascending and descending order. It is true that Lean Six Sigma Expert use mean mostly as compared to median. One of the reasons, Target is decided on metric like quality rejection % or PPM or productivity – part/man-hour or Part/shift or similar target for other business metric and they present this data on monthly basis to management and compare YTD average. So mean is easily understood by management and when project moved forward and we analyse the data on comparatively low level than we use median if required as data have outlier or non-normal. One more aspect, if there is outlier in data and reason is known so you can take decision to remove or keep outlier and still use mean. Example: We can discuss below energy consumption trend. Above graph is showing specific energy consumption trend of one year. In above data set mean is 11.3 and median is 10.8kwh/part. As we can see energy consumption is high in particular month 15.6 due to low production. Although it is specific power consumption but still we can see high consumption per part due to low production and some amount of fix energy consumption. Means if you are having zero production then also some amount of energy plant would consume. There can be two aspects in decision making one is we consider as it is and use mean 11.3 for target setting other is we remove this particular month outlier and recalculate mean which is 10.9 and more close to median or we can use median 10.8 If we are removing this particular outlier than its mean this particular reasons will not reoccur in next year or if this is something seasonal trend and production is usefully low in particular month than you do not want to remove outlier and you may take mean as 11.3 for target setting. More interestingly in case of removing outlier we may still use mean but not median because many people does not understand difference in mean and median so to explain them easily lean six sigma expert use mean for target setting. Other thought process is if mean and median is different of a data set than it means data is having some outlier or specific reason for particular performance so management will think that some of the reasons would always be there and there will be some inconsistency due to current business environment of VUCA. So instead of using median, use mean and show reason for outlier or inconsistency. So this thought process can be more useful for current business scenario. So because of above reasons, the belief is that it is difficult to move the needle with the median and Lean Six Sigma expert use mean for target setting.
-
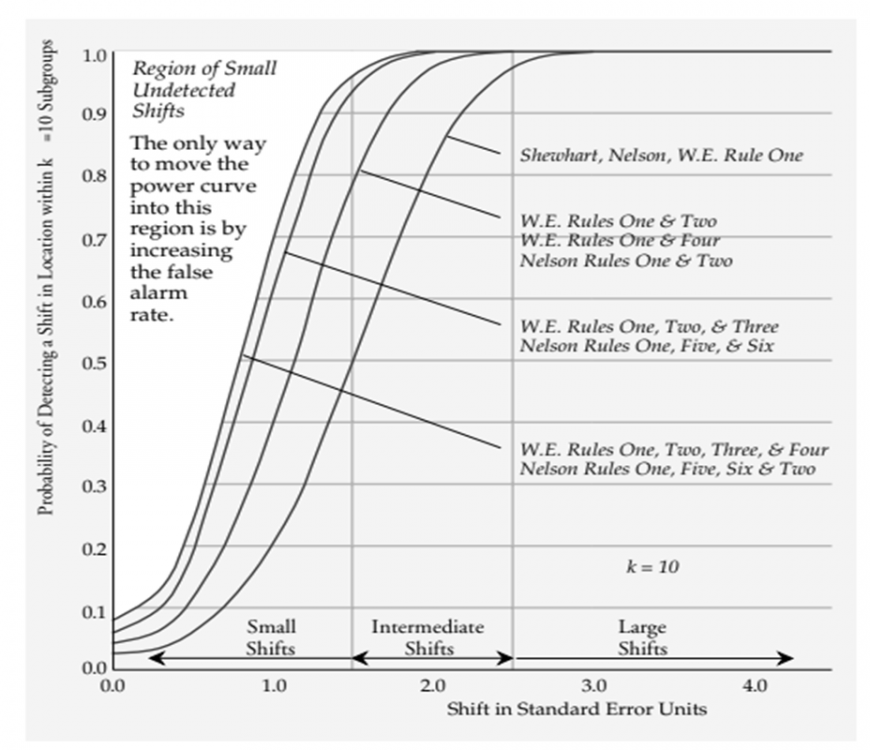
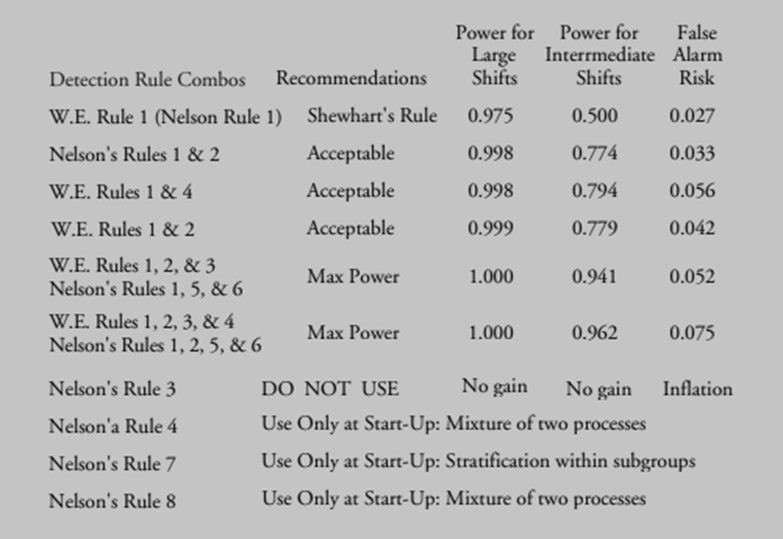
Himanshu.Sharma replied to Vishwadeep Khatri's topic in We ask and you answer! The best answer wins!Walter A. Shewhart introduced control charts in 1924. These control charts are very important tool to detect abnormality in process. In control chart UCL and LCL represent +/- 3σ limits based on historical data collected from process. So if any point falling outside of UCL or LCL is suspected as an abnormal situation and indicate us to analysis assignable causes. So if point falls within UCL and LCL limit than process is in statistical control and there is no need to suspect any abnormality. Lloyd S. Nelson published Journal of Quality technology in 1984, as there is possibility of other situations with low probability of occurrence, even all the points could be within the control limits. So such situations also indicate presence of special causes. Nelson 8 rule helps to identify special causes in which Rule -1 is original case of a 1 point out of UCl or LCL. Rule one is sufficient for most cases. Nelson rule one will detect more signals than you will have time to investigate. So question is why other rule are there and why we should not use ? Below figure gives clue that whenever you add a detection rule it has the effect of moving the power function curve left. As you add more rule these incremental improvements in power become smaller. So the additional power gained by using an extra detection rule will never be a great as it looks when detection rule being considered. As power function reach to limit the only way that detection rule has of moving power curve to left is by beginning point of curve to shift upward. As sown in figure below: When we use extra detection rules, it increase chance of a false alarm and using rules that have less and less power. Below is recommendation for detection rule:
-
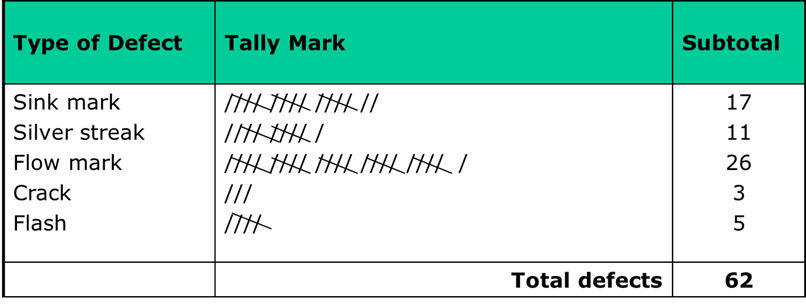
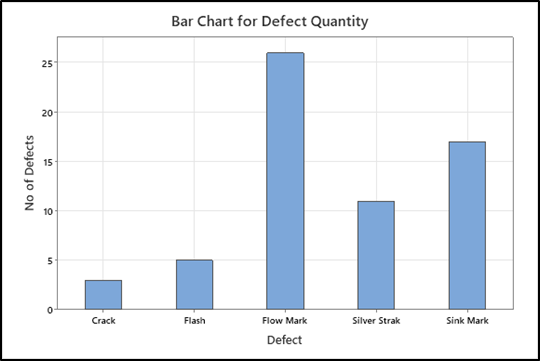
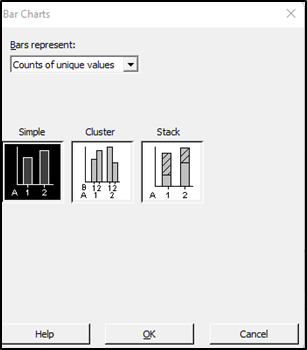
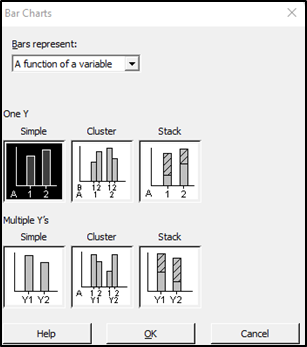
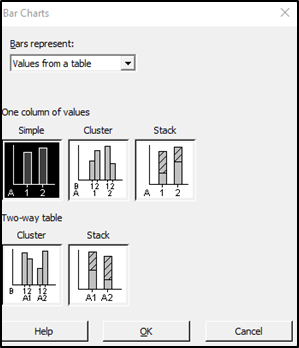
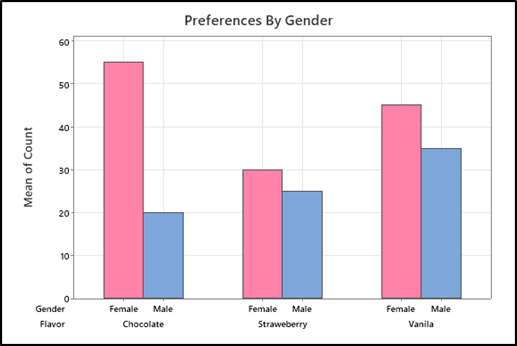
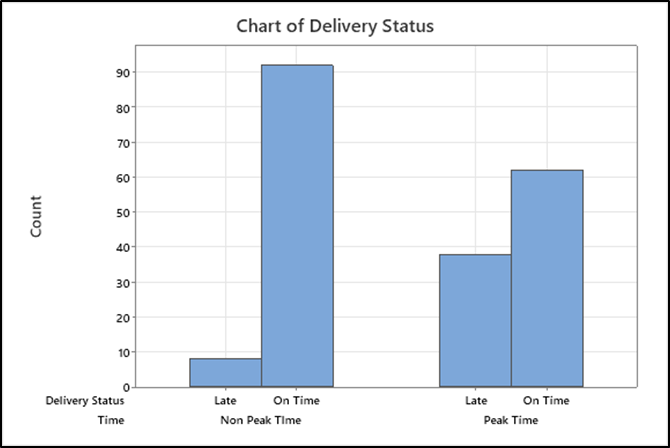
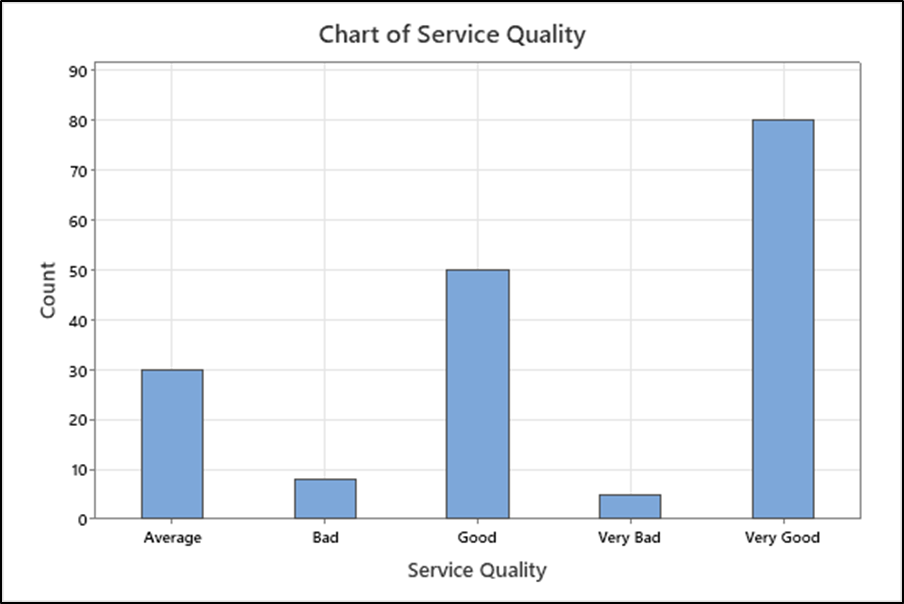
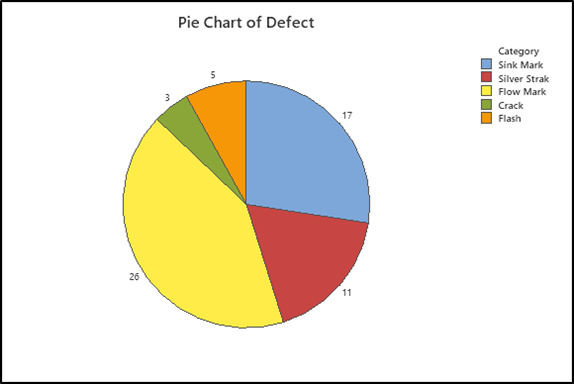
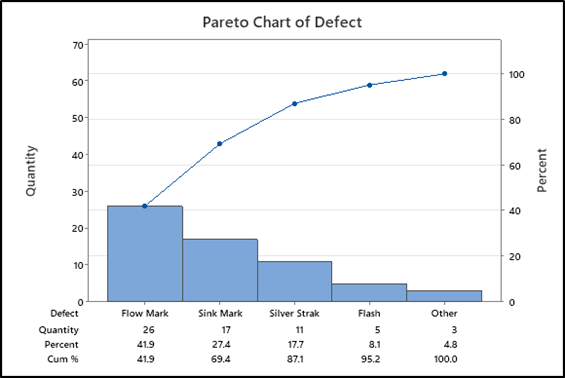
Himanshu.Sharma replied to Vishwadeep Khatri's topic in We ask and you answer! The best answer wins!Background: Quantitative data is divided into two categories – Discrete and continuous data. As No. of water drops is Discrete but volume of water is continuous. So when data is countable and can take certain value it is called Discrete data, whole no is used to write Discrete data, Example – Number of student in a class, Number of player in cricket team, Number of Defect per day, Number of books in Book shelf etc. Following type of Graph can be used to represent summery of discrete data: 1- Frequency table 2- Bar Chart 3- Pie Chart 4- Pareto Chart In Frequency table values are represented thorough tally mark representing frequency of data. Below example shows defect monitoring in injection moulding process. Tally mark helps in live data monitoring to avoid end of shift reconciliation. Summery of data can be used for different type of bar chart. Bar chart use to do following: 1- Compare counts by category: 2- Display a frequencies on y axis 3- Understand relationship between categorical variable. In Below Example: Bar chart shows Summary of defects on X axis and defect frequencies on Y axis - help to visualize defect wise frequency as shown in below example: In Minitab and Excel many option are available for bar charts based on requirement. Below options are available in Minitab: Cluster Bar chart showing comparison between Male and Female and preferences for ice cream flavour as shown below: Another Example: Pizza delivery service promise to deliver pizza in specified time. Delivery status compared with time as peak and non-peak. Below possible outcome can be seen using bar graph that peak time having more late deliveries compares to non-peak time. Bar chart for Ordinal data: Service quality compared on 5 point Likert scale for customer feedback. As below: 1- Very Good 2- Good 3- Average 4- Bad 5- Very Bad Pie Chart: We can also make Pie Chart as shown below for defects to see frequency or proportion distribution for of each defect: Pareto Chart is combination of line and bar graph and used to prioritize focus area for project.Below pareto chart shows Flow mark contribute maximum as 41.9% and flow chart and sink mark contribute 69.7%. It shows frequency of defects on primary axis and cumulative percentage on secondary axis. in Below Example X Axis and Primary Y axis using discret data and secondery Y axis having variable data. Above example can be used to present graphical summery of discrete data and required inferance can be drawn.
-
Himanshu.Sharma replied to Vishwadeep Khatri's topic in We ask and you answer! The best answer wins!Dr. Walter Shewhart of Bell labs developed a theory of Statistical process Control in 1924. Dr. Shewhart presented his theories in a series of lectures that were published in a book. Economic control of Quality manufacturing Product 1931. SPC came into wide use during 1940 as a result of war production effort. Dr Shewhart think that All process display variation There are two component of variation 1- A steady component that is inherent that Dr. Shewhart attributed to chance and undiscoverable causes, currently called random variation. 2- An intermittent component attributed to assignable causes that could be economically discovered and removed. Variation of a particular process characteristic can be quantified by sampling the characteristic and estimating the parameters of distribution. Changes in the distribution can be revealed by plotting the parameters versus time. Dr. Walter Shewhart define 8 rule to detect variation and out of control condition of a process. Tests 1, 5, 6, 2 defined by the Western Electric CO (1958) as the original 4 rules. Test 2 modified to from 8 to 9 points and after modification test 1-8 are defined by Lloyd S. Nelson (1984). These 8 rule to detect and control variation has been defined in different book by different author and one of the popular books by by Douglas C. Montgomery, 2012. Below is the Nelson 8 rule to detect and control variation : 1- 1 point above UCL or Below LCL, Indicates Large change in process 2- 2 Point above/ below 2 σ Indicates Major special cause variation 3- 4 out of 5 point above/ below 1σ Zone Indicates A small shift – special cause 4- 8/9 point in a row above/below centre line Indicates Process Mean shift 5- 6 point a row increasing or decreasing (trend) Indicates A trends up or drift 6- 15 point in a row +/- 1 σ – near centre line Indicates Old or incorrect limit, within subgroup variation is large compare to between subgroup variations. 7- 14 point in a row alternating up and down Indicates alternating pattern due to over adjustment, shift to shift or machine to machine variation. 8- 8 point in a row above 1σ and below 1σ Indicates Mixture pattern due to over control or 2 different processes on same chart. The 4 Western Electric rules that indicate an out of control process condition. The position of data point and their trends compared to the centre line value (mean) and control limit indicate out of control or non-random signal in data present. Four Western Electric rules are: a. 1 point above UCL or Below LCL b. 2 out of 3 point in a row falling in 3σ or above zone c. 4 out of 5 point above/ below 1σ zone d. 9 Point in a row one side of centre line. The Westgard rules are a set of modified Western Electric rule, developed by Jemes Westgard Mainly focus on faulty accuracy or precision of the measurement system. They are used for laboratory quality control, in runs consisting of measurement of multiple samples and published in his book seminars on quality control. Below are the rules: 1- 1 Point above or below 2σ Indicates inaccuracy or imprecision 2- 1 Point above or below 3σ Indicates inaccuracy or imprecision 3- 2 Consecutive point above or below 2σ same side of centre line Indicates inaccuracy or imprecision 4- 2 measurement in same run have 4σ difference such as 2σ above mean and 2σ below mean Indicates imprecision 5- 4 Consecutive point above 1σ same side of mean Indicates Inaccuracy 6- 10 Consecutive measurement same side of mean Indicates Inaccuracy in measurement Conclusion: So first decide objective to use control chart and decide which control chart is usefull and what data needs to collected. Ensure to train people on control chart concept and make them understood about importance and use of control chart. Many time we experience no enough care being taken in data collection as not following define intervals, in correct measurement that may result in wrong decision based up on data. To find out causes closely observe Man, Machine, Material, Method, Environment & Process parameter etc. Control chart will indicate you problem which can give direction to investigate further and arrive at root cause.


-
Himanshu.Sharma replied to Vishwadeep Khatri's topic in We ask and you answer! The best answer wins!Short term capability is sometimes calculated as Zlt +1.5 – Mostly when data is discrete because discrete data is almost every time long term or long term capability is sometime calculated as Zst -1.5. More often we have short term data and we calculated short term capability and to calculated long term capability we subtract 1.5 as Zst-1.5, because long term variation is more than short term variation. If focus on Y=f(X) , ie Output is function of Input than in short term there is very less variation in input factors as Man, machine, material , method, Mother Nature (Environment) and we get better Sigma level or capability but in long term input factor changes and effect output Y as well. So in long term 1.5 sigma level shift considered. Below is the Example of long term variation: Y=f(X) Output Y = f( man, machine, Material, Method, Measurement, Mother Nature) Man – If we see man variation on long term is very significant because a man may be consistent for a month but for a year or six month he takes leaves, or leave the job then new man join or time to time change in his thoughts, mood and efficiency & focus, leads to more variation compare to short term. Although manpower training and competency process is to take care this factor but still variation will more in long term. Machine – Machine may be consistent in short term means we get less variation in output of a hour or a shift compare to variation in output of six month or one year. Machine wear tear increase with the time, inadequate preventive maintenance, machine breakdown etc leads to more variation in long term. Machine Setting is also important aspect if machine setting change on every setup then process shift and more variation in long term. Companies do preventive maintenance and machine accuracy checks but still as machine gets older, consistency in output reduces and results in more long term variation. Material – Input material consistency also change with the time for example – a sheet metal coil having less variation within coil but more variation between coils. Means one coil is not same as other coil. Another factor is Batch to Batch variation so batch to batch variation is more than within batch variation. Within coil, Coil to Coil, batch to batch variation is more than output may not be consistent in long term. Method - To control method we have defined SOP and training to operator but if manual process and lack of poka yoke then some inconsistency can take place which can affect output. Ineffective root cause analysis also affects methods, which may lead to wrong countermeasure and unintended change in methods. Adherence of SOP by operator is also important if sop is available, displayed but operator does not follow consistently then variation will be more in long term. Measurement – Consistency in measurement is also important in long run. In long run instrument or gauge wear tear take place so time to time Gage R&R and gage Stability study require. If our measurement is not consistent in long term then variation will be more in long run. Mother Nature – Everyone likes nature variation as different weather, day night, morning evening but sometimes it leads to inconsistency in process and effect output. For Example – Investment casting process require stable environment as less temperature and humidity. So Investment Casting industry located in Nashik, INDIA because of more suitable environment compare to other part of INDIA. We all know long term variation in always more than short term variation in Environment which lead to high variation in long term. So from above examples we understood that no process can be static over the time, even excellent process. By Convention, this long term variation is defined as 1.5σ Correction in short term α level. A 6σ short term process is considered 4.5α long term process. One more way to look at It: · Variance Within each subgroup can be pooled to determine an average of the within subgroup standard deviations. · Total Standard deviation is calculated from all of the data without regard to subgroup. · Pooled standard deviation does not account for between subgroup variation. Total standard deviation does. · Pooled Sigma is best estimate of within group variation. Short term and Long term Data Collection Short term · Gathered over limited number of cycle of interval. · Gathered over limited number of machine or operator. · Almost Always Continuous variable data Long Term · Gathered over many cycles, intervals, equipment, operator. · May be discrete or continuous · Discrete data is Almost always long term. Below is the short term and long term Sigma Level and respective yield: Sigma Level Short Term Sigme Level Long Term % Yield 2 0.5 69.15 3 1.5 93.32 4 2.5 99.38 5 3.5 99.98 6 4.5 99.99966 So it is a valid assumption that consider 1.5σ shift in long term.


-
Himanshu.Sharma replied to Vishwadeep Khatri's topic in We ask and you answer! The best answer wins!TRIZ is an acronym for “Teoriya resheniya izobretelskikh zadatch” which means “Theory of Inventive problem Solving”. Genrich Altshuller with his colleagues invented TRIZ. Altshuller began to work in TRIZ in 1946 and first paper on TRIZ published in 1956. TRIZ started in Soviet Union and after 1980 concept caught up in other countries. Triz resulted in 1000 of invention and gave birth to various inventions. Triz provides 40 principles and 76 standards which empower you to match a solution suited to your problem. Different Type of Contradictions in TRIZ . TRIZ identifies contradictions as the primary issue related to a problem and eliminate them to develop a solution. Three types of contradictions exist in TRIZ: 1- Administrative Contradictions: Administrative contradiction means something is required to improve the situation but solution is unknown. For example we want to increase quality of production but want to reduce raw material cost price. These situations create opportunity for inventive situation. 2- Technical Contradiction: means two evaluation parameter are in conflicts with each other. Technical contradictions represent conflict between two subsystems or between a sub system and external environment. For Example: a washing machine motor version 1 fails in temperature rise test. Version 2 motor after improvement pass in temperature rise test but fails in noise test. So here is technical contradiction between motor temperature and noise parameter. 3- Physical Contradiction: A system or an object might have requirements that are dissimilar, resulting in physical contradictions. For example in motor example, to avoid temperature and noise problem, we require to increase motor size but increasing motor size is not suitable for washing machine. So this becomes physical contradiction. To overcome physical contradiction you have to think for technical innovation means how to achieve temperature and noise specification of motor without increase in motor size. In this example we understood by changing motor size we can convert technical contradiction into physical contradiction. Another Example: Design a cupboard to store many items but should not take too much space. So it is easy to design cup board to store many items but contradiction is size which is physical contradiction. So you need to think technical solution to optimize size as either detachable or can be folded to reduce space. So it converts into technical contradiction. In this example we changed physical contradiction into technical contradiction. From above examples we understood that there can never be situation when you have a physical or a technical contradiction only. Both are different but interrelated. So, Technical contradiction can be converted into physical contradiction.
-
Himanshu.Sharma replied to Vishwadeep Khatri's topic in We ask and you answer! The best answer wins!What is Effect Size? Effect Size is the minimum difference that the researcher wants to detect between study groups and is also known as minimum clinical relevant difference. One can estimate the effect size by pilot study, previously reported data or guess based on clinical experience. To understand Effect Size better we can discuss example – Suppose Drug A effect on average blood pressure as reduction by 10mm of Hg and drug B effect reduction of 20mm Hg. Then, absolute Effect size will be 10mm of HG in this case. Effect size can be expressed as absolute or relative difference. In this example relative difference is 50% or 10/20. In continuous outcome effect size will be numerical and in binary outcome effect size will be yes/no, investigator can estimate the relevant difference between the event rates in both trials groups and select, for example a difference of 10% between both the group as effect size. Effect size will also determine the sample size. As sample size is inversely proportional to the square of difference. I.e. If effect size is smaller then sample size would be large. Why report Effect Size or P Value? P value just inform the researcher weather effect exist of not, P value will not show size of effect. In report interpretation, both effect size and p value are essential to report. For this reason effect size should be reported in in report by researcher. Example: Comparing two proportions A study was conducted to see effectiveness of drug in preventing shivering. It was found effect off drug in reduction of shivering is 70% to 30%. It is considers as significant effect in shivering reduction. What would be sample size? if α =0.05, Power is 0.95 So in this example Effect Size is P1 – P2 = 70%-30% = 40% And Sample Size using Minitab is Test for Two Proportions So sample Size is 32 nos. & effect Size is 40%. If we change Effect Size to 10% than what will be sample Size? So let us consider P1 = 70% and P2 =60%, so what will be sample size keeping other parameter same; Using Minitab: So sample size increased from 32 to 490 nos, if effect size reduces 40% to 10% if effect size is small and sample size is not enough than there is risk of Type 1 and Type 2 error. Means Type 1 error is rejecting null hypothesis when it is true and Type 2 error is rejecting alternate hypothesis when it is true. In above case, if we compare P1 and P2 than we may get P value < 0.05, compare to α = 0.05 which is significance level for decision making and reject Null hypothesis as Ho: P1=P2, & alternate Hypothesis will be true as Ha:P1>P2. So P value just tells whether there effect exists or not, but not size of effect. So it is necessary for researcher to report Effect size in their report.
-
Himanshu.Sharma replied to Vishwadeep Khatri's topic in We ask and you answer! The best answer wins!Each project needs organizational support. Six Sigma executives and champions set the direction for selecting and deploying projects. They ensure, at a high level, that projects succeed, add value, and fit within the organizational plan. Champions: Ideally Six Sigma Champions set direction for six sigma project. They ensure at high level that which projects add more value and fit into the organizational plan. Also identify resources and remove road blocks. For Example: Head of Department, Plant head and above levels are champion in organization. These people know about company’s vision, mission and organizational goals and challenges. In practical scenario these top level people are so much busy and it is difficult them to give time for project selection and giving direction. In this process, master black belts and black belts make list of projects based on KPI and data available with them and present to champions for approval and they approve. There is a risk that if these projects are not connected with financial goals of the company than real benefit of doing these project may not visible to stakeholders and stakeholders may lose interest on Six Sigma projects. So what is the Solution for the real problem? Empower Master Black Belts and Black Belts by giving them access of organization financial data. So they can connect project with company financial goals. This can greatly help to identify meaningful projects and prioritize efforts. I experience this by doing Business Value Analysist course by Six Sigma Benchmark as explained by Mr. Vishwadeep Khatri. Below is the link for Business Value Analysist training program: https://www.benchmarksixsigma.com/public-programs/business-value-analyst-public/ Master Black Belt, Black Belts, Green Belts, Yellow Belts and White belts are project level people. These people conduct projects and implement improvements: Master Black Belt: Master Black Belts role is to train and coaches Black Belts and Green Belts. MBB acts as an organization’s internal consultant and six sigma knowledge resources. For Example: MBB make strategy to train people on Six Sigma and identify projects based on key metrics and strategic direction. MBB review six sigma Black Belt and Green Belt projects and given them guidance for successful completion of projects. MBB is the key resources between management and project teams. On completion of six sigma training MBB conduct exam to review training effectiveness. MBB also can certify Black Belts and Green Belts if participants qualify as per set criteria. It is important that MBB should have knowledge and experience so that he can give practical examples in training and guide and motivate people. Black Belt: A Black Belt is a catalyst for change! Black Belt certification is most demanding in the Lean Six Sigma program. A deeper knowledge of DMAIC is required as a first step. Black belts manage project teams and identify the challenges and areas for improvement in line with future strategy. They will work with various groups and coach others to be team leaders. Someone on this leadership role must be highly qualified, with knowledge, experience and skill in change management, psychology and human behaviour. Black belts will better understand the team members, allow them to decide how best to use their talent. Below are the ten qualities of black belts: 1- Good communication 2- Courage 3- Integrity 4- Honesty 5- Leadership 6- Team work 7- Self-control 8- Belief 9- Assertiveness 10- Discipline Green Belt: Green Belts lead green belts project teams and assist in data collection and analysis for black belt projects. Green belts are very important level for six sigma projects to provide data. As Six Sigma is data base approach so data correctness is very important. Sometime black belt face difficulty that data collected by green belts or responsible person is not correct or delay in data collection. Especially data collection becomes challenging in manufacturing process and it required lot of time and effort of green belts. Green belts must understand importance of data and ensure data quality. Data is base for any decision making and it became foundation for Six Sigma projects. So there should be discipline for data collection in organization. Yellow Belt: Yellow belts are potential member to become Green belt. They participate as project team member and support the projects. White Belt: Understand basic Six Sigma concepts from awareness perspective. White Belts Can work on local problem solving teams that support overall projects but may not be part of a Six Sigma project teams. So in Six Sigma Organization each level is important and linked with each other. In conclusion Champion set the direction, Master black belts coach Black belts and Green belts, Black belts identify projects and support Green belts, Green belts assist in data collection and help Black belts in analysis, Yellow and white belts assist green belts. So an individual can set his /her growth path by joining Six Sigma organization and grow in his carrier. Below image clearly shows levels of Six Sigma and growth path:

-
Himanshu.Sharma replied to Vishwadeep Khatri's topic in We ask and you answer! The best answer wins!Scrum master role is very crucial and important depending on situation and context. Everything with the purpose of helping people and applies Scrum framework better. I will share the different situation in which I try to be relevant for the Scrum master. this blog will describe the most common definitions and examples of an impediment, the Scrum master as an impediment remover and how to deal with impediments. What is an Impediment? Below is the good definition about impediment: An Impediment is a factor that restricts the development team in its creation of a valuable piece of software, or restricts the team in achieving its progress. Challenges or problems that go out of self-management of the development team An event that impedes any of the team from working of their estimated speed. Some nice quotes about impediments are: "A good Scrum Master creates an environment where raising impediments can occur. A great Scrum Master creates an environment where creativity can occur." “A good Scrum master creates an culture where creativity can occur.” “A great Scrum master will remove impediments to improve team productivity and will prepare for forgiveness.” Examples of Possible Impediments Below is the example of possible impediments: Team member conflicts Dominating attitude of few member in team Lack of team coordination Lots of unimportant meeting Lack of product ownership Team member sickness Sudden changes in team Development team tooling issue Lack of competence or required skill Lots of Technical issue Supplier issue Product owner not available Unrealistic management expectation Delay in approvals by management The Scrum Master as an Impediment Remover The Scrum master role is to guide development team towards cross functionality and self-organization. The scrum master motivates and supports the team to reach their final goal and use full potential. To achieve this, the Scrum master should ask below question: Is this real Impediment? Can team resolve this impediment themselves? What is real problem? It is important to realize that all impediments don’t have to be impediments. Is something beyond the self-managing capabilities of team than its become real impediments: Competency to perform require task can be the real impediments, but believe on team to think off other option themselves. May be team se problem as opportunity for learning and grow and find solution to learn desired skill. Also a conflict between team members does not have a real impediment. This is an opportunity for healthy debate and creates new ideas and good team bonding. It is important that there should be environment where team feels to safe to raise impediments. A Scrum master can help in creating environment. He should encourage teams in trying to solve their problems. Also should respect self-managing capabilities of teams. More important he should prevent something which can become impediment in future. Tactics for Removing Impediments Removing impediments can be a challenge. Below I've shared some tactics and ideas that a Scrum Master can consider when facing impediments. Act timely to avoid daily scrum convert into impediment. It is better to have a daily check sheet as per example Use SMART Goal, if something prevents teams from achieving SMART Goal , than is is an impediment. SMART goal can help to identify weather impediment. Realize the difference between 'blocks' and 'impediments'. If only single task is effected than it is a block which can be solved by team themselves. But if overall progress slowing down than than it is an impediments , that kind of impediments needs to solve by the Scrum master. Visual Control using an 'Impediment Board'. Impediments board can visualize all impediments easily and this can be good idea to create transparency among team and the Scrum master can monitor board on day to day basis. It can be a Daily work management board also if daily define task does not complete on time than there is some impediments which can be noticed by the Scrum master. this can greatly help to take timely action to resolve impediments. Monitor of fixed impediments. This will provide great input for the Sprint Review and Sprint Retrospective. Organization Culture. Each organisation having different culture and its way of working, the scum master should be aware about it and he should understand how things done in the organization effectively. This can save lots of time and efforts in resolving impediments of development team. Be Strong and creative in eliminating impediments. The scrum master should ready to ask for forgiveness afterwards when he need to take strong decisions to ensure the development team efficiency. Coordinate with key Stakeholder as the Product Owner. It is important to coordinate and communicate with product management and stake holders and suppliers. Product owner is key player on this area ensure a healthy relationships with the product owner and key stakeholders. Save time and efforts: as we discuss in beginning that The Scrum master should focus on real problem, not on all problems. Understand situation and check it is really impediment or a opportunity for development team learning. Conclusion By doing some research, I drafted the conclusion of scrum master as an Impediment remover. Mainly I learned is to respect the self-organizing capabilities of team. If every minor issue to be resolved by scrum master, than how team will grow? so it is important to develop team and they have to learn by daily impediment.


-
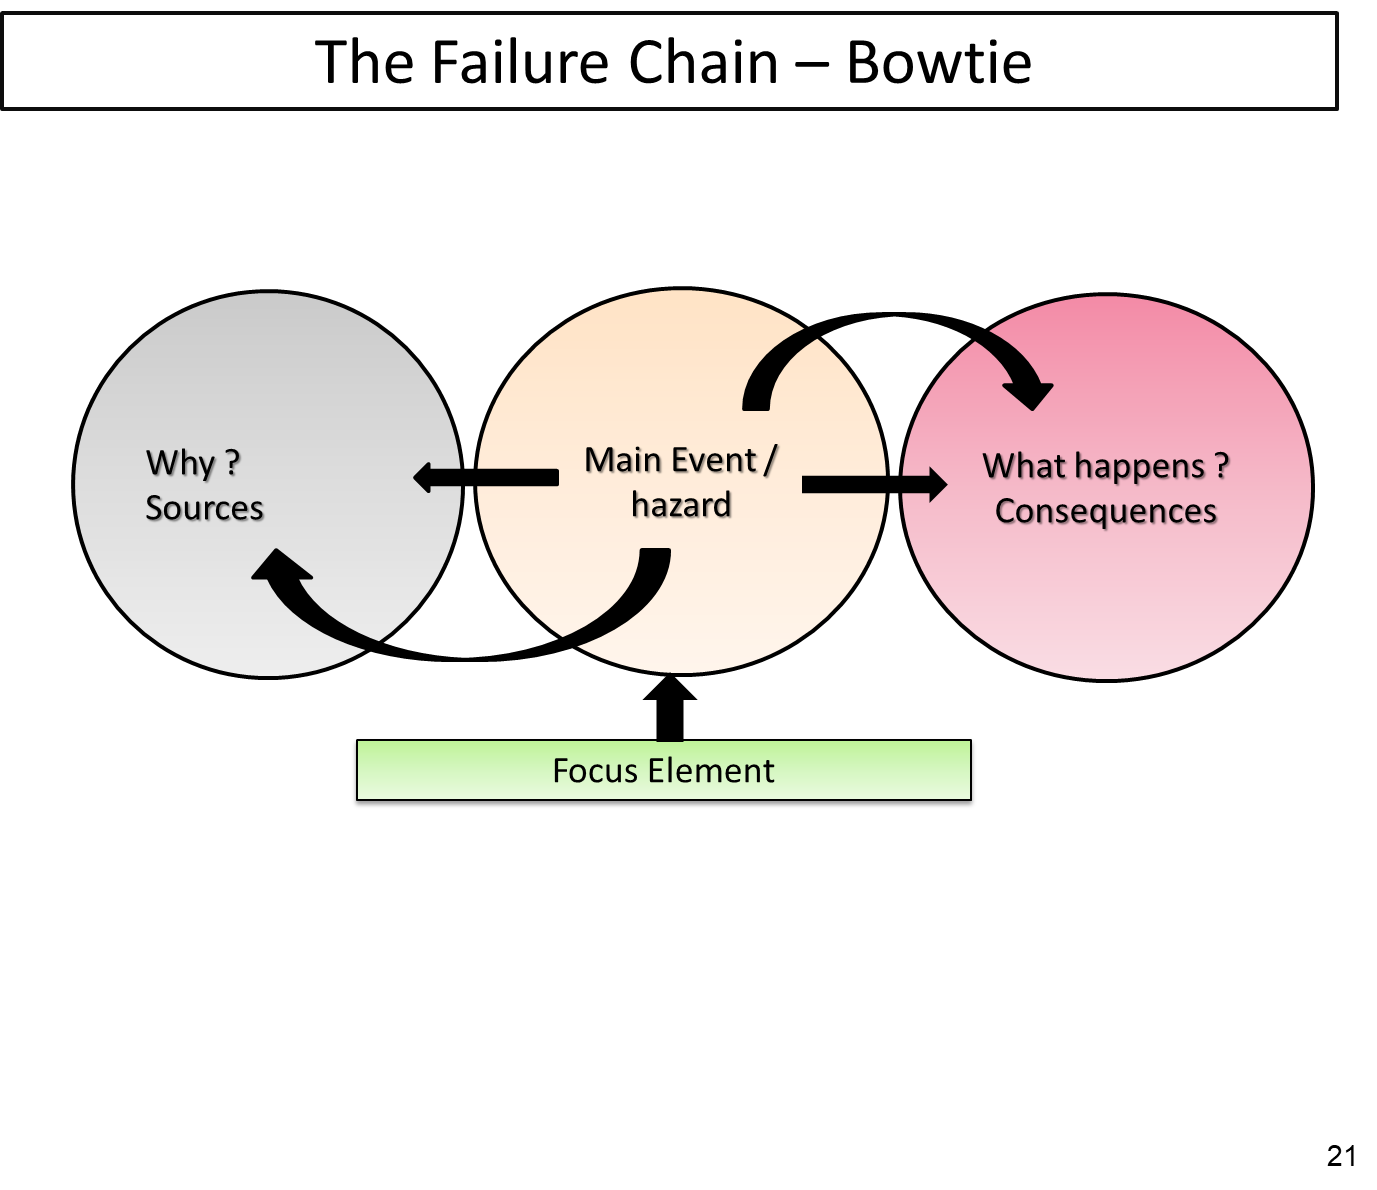
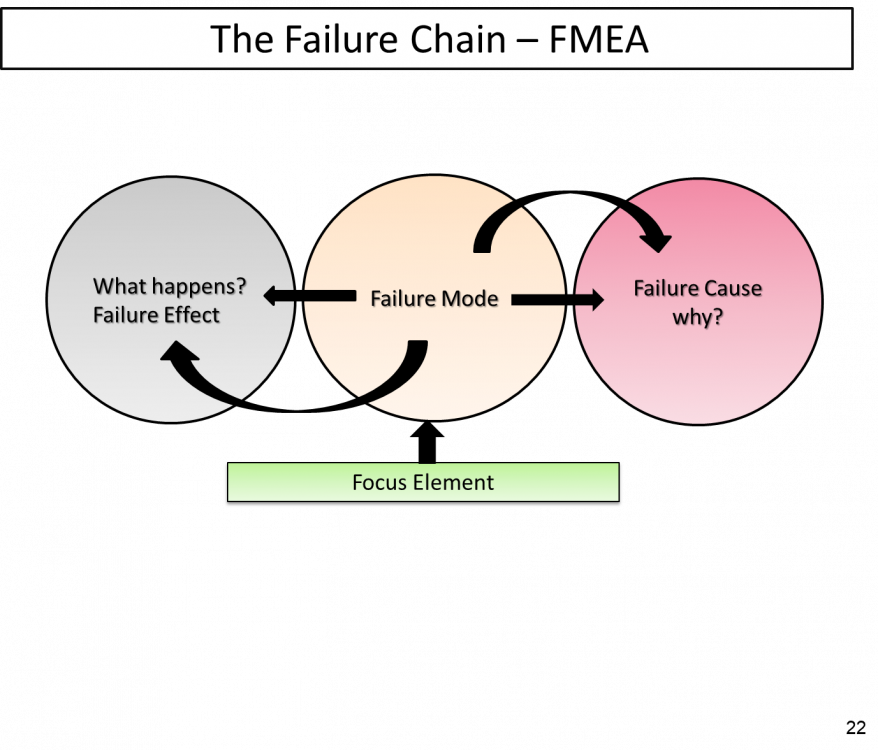
Himanshu.Sharma replied to Vishwadeep Khatri's topic in We ask and you answer! The best answer wins!What is Bowtie Analysis •The Bowtie analysis has been attributed back to Royal Dutch Shell in the 70’s / 80’s. Since then, oil and gas, mining and pharma companies amongst others have used the Bowtie technique to identify and mitigate risk. More recently, financial institutions have warmed to the idea, seeing the benefit of this simple, yet comprehensive method to understand and communicate risk. The Bowtie technique is a logical way to explore and communicate risk. Its principles are simple, but the execution and presentation need care. Bowtie analysis is to asses high level of risk. It is a hazard identification and risk mitigation tool. It looks like a Bow tie , centre or knot of tie is the main event/ hazard and left hand side sources for main event and right hand side consequences as shown in picture: •There are 7 steps for Bowtie analysis as below: 1-Identify hazard 2-Identify Top Event 3-Identify Threats 4-Identify Consequences 5-Identify prevention barrier 6-Identify Mitigation barrier 7-Identify Escalation barrier Below is the Example: •Compare to FMEA, Bowtie analysis simple and visual tool. FMEA is team oriented ,more systematic method to identify and mitigate technical risk .FMEA one of the core tool asper IATF -16949 requirement for automotive industry. •As per latest FMEA AIAG VDA1st eddition - June 2019, it categorise Action Pririoty to mitigate risk into High , Medium and Low category based on Severity, occurrence and detection ratings. There are 7 steps for FMEA as per AIAG VDA standard: 1.Planning and Preparation 2.Structure Analysis 3.Function Analysis 4.Failure Analysis 5.Risk Analysis 6.Risk Optimization 7. Result Documentation Step 1 :- Planning & Preparation covers the scope definition project team make-up and project planning aspects of the study. A clear definition of the scope, set by the management team, minimize the probability of “Scope creep.” Project Planning is done following “Five T’s” and should be covered in the FMEA kickoff meeting. The information from this step is the basis for Step 2. Step 2 :- Structure Analysis is used to identify and breakdown the system (Design or Process) into the system, subsystems and component element so that a comprehensive risk assessment can be conducted. This information is the basis for the next step. Step :- 3 Function Analysis analyzes each system element identified in Step 2 in terms of its intended function(s) and corresponding requirements. The Function Analysis leads to a comprehensive and relevant Failure Analysis in Step 4. Step :- 4 Failure Analysis marks the beginning of the next phase of the FMEA, Failure Analysis and Risk Mitigation. The purpose of the Failure Analysis Step is to identify failure modes, failure effects and failure causes to establish the basis for the risk assessment. Step :- 5 Risk Analysis is where the level of risk for each failure mode is evaluated in terms of Severity, Occurrence and Detection (S-O-D).Items are then assigned an Action Priority Level of High, Medium or Low. Step :- 6 Risk Optimization is the step where plans are developed that reduce risk and increase customer satisfaction by improving the design or process. Step 7 :- Results Documentation is the final step where the results of the FMEA study and fully documented in a report. Only Failure analysis steps seams similar to Bowtie analysis which shows relationship in failure chain. In FMEA Focus element is failure mode. If you question why failure mode occur then you will get answer of failure cause and what happen when failure mode comes than answer is failure effect. Similarly in Bowtie if focus on main event and question Why ? Than answer is Sources and if question what happens than answer is consequences. As shown in picture below:


-
-
-
-
Hi Mahendra Answer of your first question is that the example i have given to you is for line production where n no. of peoples are working and doing different activity to manufacture final product. So it will come as PRODUCTIVITY for this LINE. If a single operator is manufacturing that product than we have to calculate it operator wise. I think now it is clear to you. If u split the productivity then it will come as Production/person/Hour. you are right but if this is productivity than what will be the operator efficiency. Operator B 100% productivity will come if Operator B is 100% EFFICIENT so his Efficiency is 100%. While productivity of operator B is 60 part/man/hour or 1part/man/hour. Productivity is output using Unit resources so you can say 1part using 1man and 1 min. Regds, Himanshu
-
Hi Friends Productivity is PRODUCTION/MAN/HOUR. OR RETURN/RESOURCE. Ie: IF 4 MAN PRODUCING 100 PARTS/hr. THEN PRODUCTIVITY IS 100/4=25PARTS/MAN/HR. EFFICIENCY IS UTILIZATION OF FULL CAPACITY IE IF A LINE CAPACITY IS TO PRODUCE 1000PARTS PER DAY BUT IT PRODUCE 800 PARTS IN A DAY THEN ITS EFFICENCY IS 80%.