D. Nandakumar
Lean Six Sigma Black Belt
-
Joined
-
Last visited
Everything posted by D. Nandakumar
-
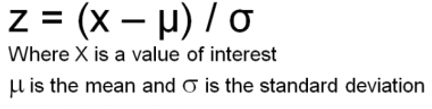
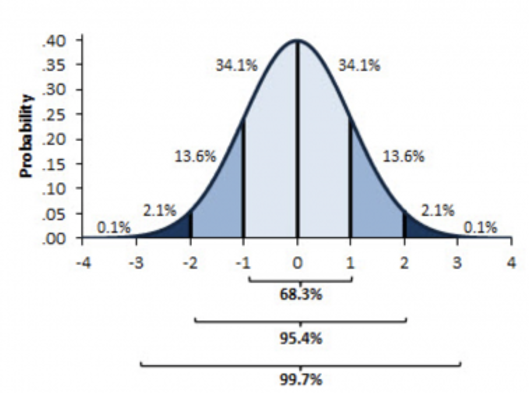
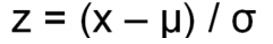
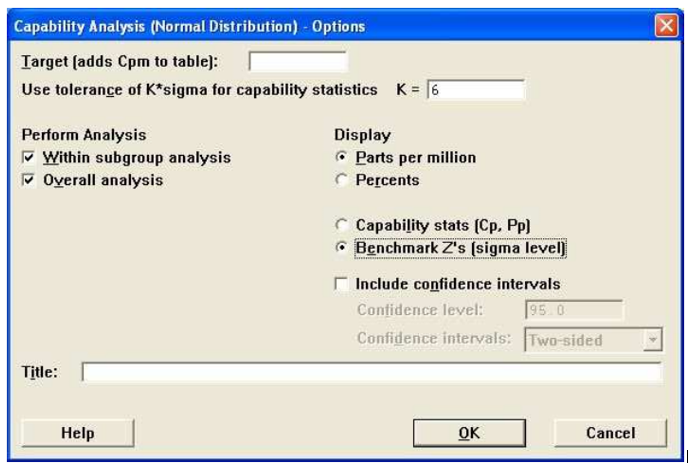
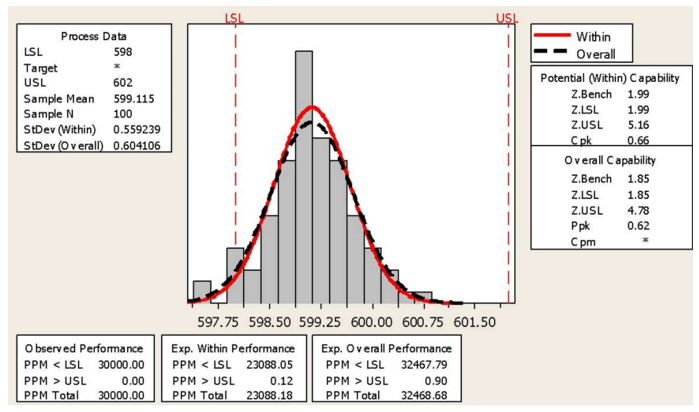
Before we go into an explanation of Z.overall, Z.within and Z.bench, We need to first understand what is meant by the letter Z. “Z” is the number of standard deviations between the mean and the specification limit. In process capability calculation it is the mean distance from USL and LSL measured in Standard deviation. The formula for calculation Z. score is The graph below indicates the probabilities associated with the normal distribution and Z values. For example: our customer lead time is 240 minutes. Historically, lead time average is 150 minutes and a standard deviation of 55 minutes. Assuming a normal distribution, Z score is, = (240 – 150) / 55 = 1.63 i.e., 1.63 Standard deviations above the mean. The Z score is very useful because it can convert any continuous measurement into a generic value, allowing comparisons between different process is easier. Z.bench can be used as measure of process of capability. Various Z.bench calculation are Zwithin or ZST and Zoverall or ZLT Minitab has a selection to calculate Benchmark Z’s or Sigma levels along with the Cp and Pp statistics. By selecting the option in minitab, these graph as shown below will be displayed. Difference between ZOverall and Zwithin: Sl. No Zoverall or ZLT Zwithin or ZST 1 It is an indices used as an alternate to Pp It is an indices used as an alternate to Cp 2 Zoverall indicate the actual long-term capability of the process Zwithin indicate the potential short-term capability of the process 3 Z is calculated using the overall standard deviation Z is calculated using the within standard deviation 4 Represents long term variation of the process Represents the potential variation of the process 4 Also known as Short term Z.Bench Also known as Long term Z.Bench Benefits of Z bench Ø Z bench converts continuous data into a number of standard deviations, which can be used as Generic value of measurement between the process. Ø It serves as a tool for comparison between different process. If the Process “X” has a higher Z bench than process “Y”, Process “X” is better in meeting specs than process “Y”. It doesn’t matter what the process type, the comparison is relative measure of capability. Ø Process “X” is Better when compared to Process “Y” Zwithin is important in DMAIC project for determining the baseline performance because it is essentially a prediction of the ability of a process to meet a specification. However, Zoverall also important because it indicates how the actual process performed over a period of time.

-
The pooled standard deviation is a weighted average of the Standard deviation from two or more groups of data. It is process for estimating variance of several groups when the mean of each group is different. But it should be assumed that variance of each group is same. It is also known as Combined standard deviation or Composite standard deviation or Overall standard deviation. If the sample size is larger, the proportional effect will be greater on the overall estimate of the standard deviation. Formula for calculating pooled standard deviation for Three of more groups, Where, n1, n2 – The sample size of the group1, group2 S1, S2 – Standard deviation of the group1, group2 k – The number of groups Formula for Equal sample sizes, Assumptions: - Standard deviations of groups are assumed to be equal. - It gives weight to the group with larger sample size. Example with different sample sizes: Consider there are two groups as mentioned below, So the Standard deviation for group 1 is 6.4 and group 2 is 8.2 and from the calculation the Pooled standard deviation for this 2 groups is 7.46 The value of pooled standard deviation 7.46 is within the value of Standard deviation s1 and s2. By this it was understood that pooled standard deviation is a weighted average of groups. Application: - Ability to compare outcomes and validate across models. like Railway ticket reservation among various stations (PQWL – Pooled Quota Waiting list) - Health care - Sales Forecasting - 2-Sample t-test and ANOVA studies.


-
Sl. No Overall standard deviation Within Standard deviation 1 Considers all the readings from the measurements It’s an estimate of the variation within the Subgroups 2 Also known as Inherent process variation Also known as within-subgroup variation 3 Captures all sources of systematic variation Captures nature and inherent variation of the process over a shorter period 4 Represents actual variation of the process Represents the potential variation of the process 4 Represents using indices Pp and Ppk Represents using Cp and Cpk 5 Standard Deviation Calculation-Population Standard deviation calculation - Sample Within Standard deviation will be higher, if the process capability is not stable i.e., lesser than one and the sample collected as subgroups are out of spec. But the overall variation in the process is somewhat stable and process needs to be centered.


-
TPM stands for Total Productive Maintenance founded in Japan a systematic and holistic approach to equipment maintenance and strives to achieve overall equipment effectiveness, Zero Breakdowns, Zero defects and Zero Accidents. TPM gives importance to maintenance in detail on both proactive and preventative aspect of maintenance to improve the operational efficiency of equipment. It removes the difference between production and maintenance roles and strongly emphasis the machine operators to maintain their equipment. Implementing TPM creates a shared responsibility among the departments (between Maintenance, Production, Quality, Purchase, etc.,) and increases involvement of the operators from shop floor on maintaining their machines thus it improves their morale and very effective in improving productivity, reducing cycle times, and eliminating defects, etc., Before Implementing TPM, Basic condition’s needs to set right thru 5S. 5S is the systematic methodology used to organize the for workplace. Hence, 5S is Basic foundation for TPM. · Sort out waste (Seiri) · Systematic arrangement (Seiton) · Shine the workplace (Seiso) · Standardize (Seikietsu) · Sustain thru self-discipline (Shitsuke) The main objective of TPM is to improve the Overall Equipment Effectiveness (OEE) of plant equipment. TPM focuses on the deterioration and production losses by creating the right environment between operators and equipment to create ownership. Most of the companies appoints consultants from JIPM (Japan Institute of Planned maintenance) to Impart, Educate and Implement TPM culture Implementation of TPM: 1. Establish and Implement the basic conditions right through 5S Methodology. 2. In 2023, JIPM Created a check list which can be used as Self-assessment and to check their eligibility level before applying for TPM 3. Initial Evaluation of TPM level by JIPM consultants 4. Initial introductory training 5. TPM steering Committee formation 6. Master plan for TPM Implementation 7. Training Phase by Phase for all key personals for all eight pillars 8. TPM policy and goals finalization 9. Road map for TPM Implementation pillar wise 10. Period assessment by Plant executives and JIPM TPM Awards JIPM provides 5 level of Awards in TPM and sub-category also available in each award. Level 1 - TPM Excellence Award Level 2 - TPM Consistency Award Level 3 - TPM Special Award Level 4 - TPM Advanced Special Award Level 5 - TPM World class achievement 8 Pillars of TPM TPM has 8 Pillars and each pillar will be having their own steering committee to monitor the implementation and its progress. Steering committee should comprises key personals from all functions similar to CFT. Comparison against TQM However, both TQM and TPM share a lot of similarities, Ø TPM and TQM are considered as two different approaches in maintaining and following the world class systems. Ø TQM is based on five cornerstones, i.e., The Product, The Process, The Organization, The Leadership and Commitment. Whereas, TPM is based on 8 Pillars. Ø TQM and TPM are used to increase the quality with effective utilization of resources and to delight customer. However, the road map for reaching the objectives is different.


-
Performance rate includes losses due to Reduced speed, minor stops and idling of machine. 1. Reduced speed means running the machine slower than the idle cycle time or slow cycle time. 2. Minor stops and idling of machine i.e., where the machine stops for shorter period i.e., < 5 Minutes. Common minor stops include Material jam, Misfeeds, Flow obstruction, Setting error, Misalignment, Sensor misfunctioning, and equipment design. Performance Calculation: Performance rate = Net operating time / Idle operating time Or Actual cycle time / Idle cycle time Or Actual run rate / Idle run rate Reason for Miscalculation: 1. Monitor and Recording: It’s difficult for Companies to Track, Monitor and Recording of Minor stoppages. Due to most reasons being chronic and team also have less time for manual data logging. 2. Reduced speed and Small stop: Reduced and Small stop should be separately captured and analyzed. Since the root causes of these two are typically different separate analysis are required. 3. Fixing Low Base: Typically, when a cell is “balanced”, meaning that the Nameplate Capacity of all contributing machines or stages is designed to produce at reasonably close to the same rate, In that scenario, the fastest stage should be kept as target, not the slowest. Solution: 1. Cycle time analysis: Automation recording of cycle time for later analysis, hence manual logging can be avoided. 2. Implement Effective and improvement actions like, - Improve the Quality of information for better understanding. (E.g., Automatic logging) - Improve the Process that will mitigate the loss. E.g., Standardized work and develop skills through training. - Temporary or Quick Fix based on analysis (Referred to as ‘fire-fighting’) - Permanent Fix (permanently improve the process so the problem is unlikely to recur).
-
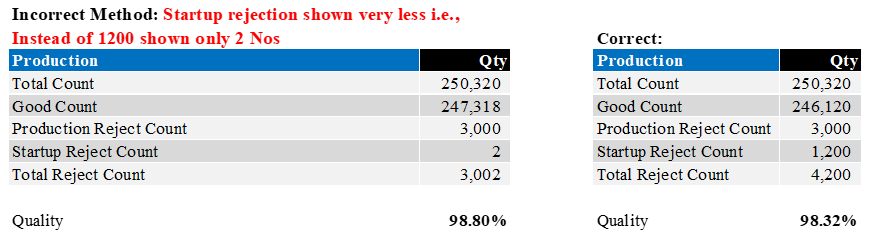
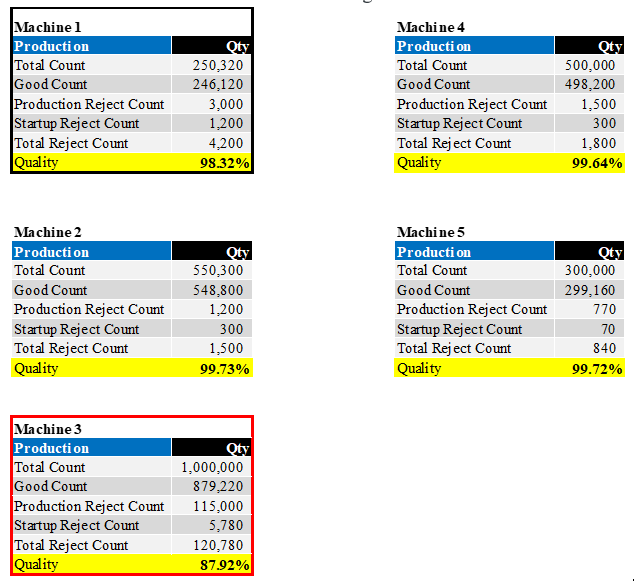
Quality Rate is the ratio of good product output out to total product output and it is one of the three parameters used in calculation of OEE along with Availability and Performance. Quality losses includes Rework, Yield, Scrap. It not only involves loss of capacity but also materials, energy, and schedules. Quality loss must include both mistakes as well as variation. There are two type of defects in Quality loss. 1. Startup defects 2. Production defects Startup Defects: Startup Defects can be defined as the defective parts produced from startup until normal or steady production is achieved. It can be after any equipment startup. However, mostly monitored after changeovers. E.g. In Cold forging after job changeovers. Production Defects: Production Defects can be defined as defective parts produced during running of stable (steady state) production. This includes parts that can be reworked, since OEE measures quality from a First Pass Yield perspective. E.g. In Cold forging, Variation in Length of the Bolt due to tool damage. Ideal condition of OEE based on Experience is Availability: > 90% Performance Efficiency: > 95% Quality rate: >99% Therefore, Ideal OEE = 0.90 x 0.95 x 0.99 = 0.85 How Quality rate is mis-calculated to inflate the OEE Numbers: 1. Rework also considered as First time right and included in the calculation of Quality rate as shown below, 1. Not including all the Startup rejects or showing less startup rejection inflates high Quality rate. 1. Measuring OEE Plant wide, which average out the readings and inflates higher OEE. Target only critical machines by using pareto analysis. E.g., The scenario shown below, Machine-1: 98.32% Machine-2: 99.73% Machine-3: 87.92% Machine-4: 99.64% Machine-5: 99.72% Average Quality rate of all the 5 Machines: 97.07% If the plant considers the Average quality rate, then actual under lying issue on Machine 3 and Machine 1 will get unnoticed and focus will be missed for taking further corrective actions. How can this be avoided and what is the right method to calculate Quality: 1. Every category of machines needs to have a maintenance standard together with the frequency and the reason for the standard. 2. Monitor the OEE along with SPC (Statistical process) guidelines and principles. 3. Machine process capability to be studied and ensure it is under control. 4. Motivating by involving the operators, team members to give them the opportunity, responsibility, Incentives, and recognition. Use small wins with feedback. 5. The OEE Calculation gives equal importance to Quality and Availability. But usually Quality is far more important because rework results in greater load and more instability. 6. A serious drawback is that no measure of variation is included in the standard OEE calculation. Hence, Machine process capability to be studied and ensure it is under control. For e.g. Two machines may have similar OEE’s of 80%, but very different variation. Machine 1: Over all OEE is 80%, but variation 20-100% Machine 2: Over all OEE is 80%, but variation 78-82%

-
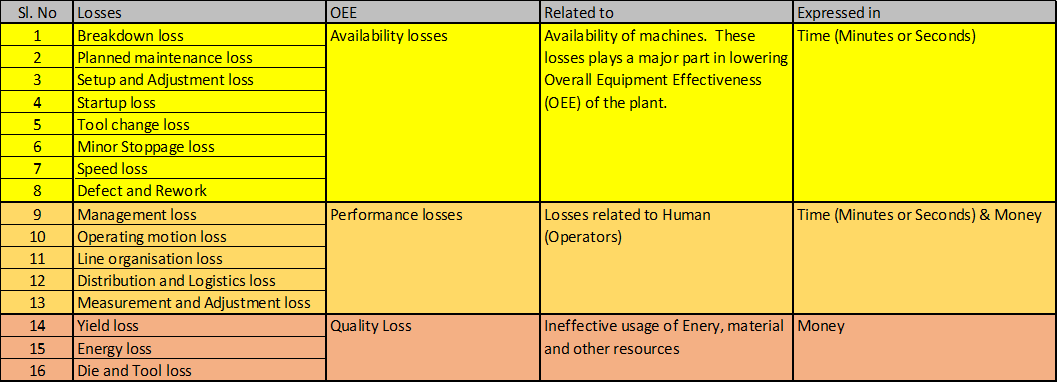
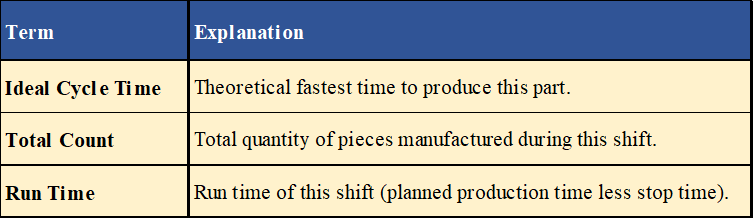
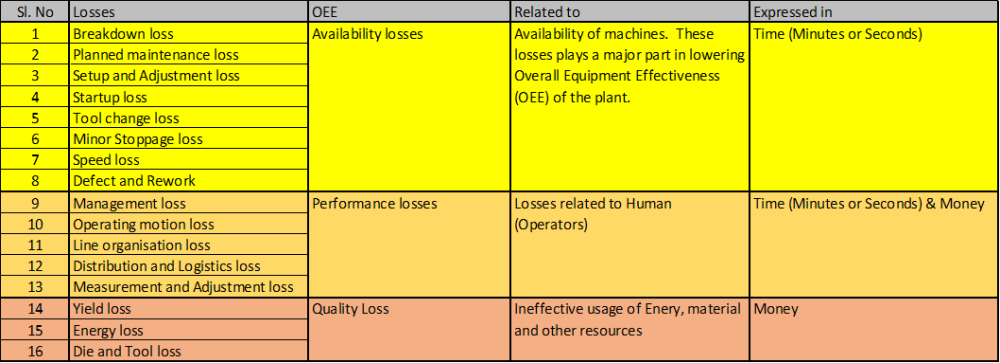
Availability is one of the three parameters in OEE calculation, Performance and Quality are the other two parameters used in OEE Calculation. Before to understand, How the factors being mis calculated. We need to understand the Calculation of OEE. In General, OEE Calculated as follows: OEE (Overall Equipment effectiveness) = Availability x Performance x Quality Where, Availability = Run time / Planned Production time - Run time is the difference of Planned production time to Stoppage time - Performance is the ratio of (Ideal cycle time x Total count) to Run time - Quality is ratio of Good count to Total count Availability: Availability loss includes all events that stopped planned production needs to be accounted. Such as - Unplanned machine stoppage’s due to Equipment failure - Material shortage and - Planned Stoppage such as changeover time. Performance: Performance Loss considers all factors that causes the Machine to operate at less than the required possible speed when running (includes Slow speed and Small Stops), Performance is calculated as the ratio of Net Run Time to Run Time. Practically, calculation of Performance is as follows, Performance = Ideal cycle time * Total count / Run time Where, Ideal Cycle Time is the theoretical fastest possible time to manufacture one piece. When it is multiplied by Total Count the result is Net Run Time – the theoretical fastest possible time to manufacture the total quantity of pieces. Example: Ideal cycle time – 1 minute Total count – 300 Pieces Run time – 420 minutes Performance = Ideal cycle time x Total count / Run time = 1* 300 / 420 = 71.4% Quality Calculation: Quality Loss considers the manufactured pieces that do not meet quality standards. Which includes the pieces that are reworked. In practice, Quality is calculated as ratio to Good count to Total count. Calculation of OEE: OEE considers all 16 losses like Stop Time Loss, Speed Loss, and Quality Loss resulting in a measure of actual productive time. OEE = Fully Productive Time / Planned Production Time Practically, OEE is calculated as: OEE = Availability * Performance * Quality If the equations for Availability, Performance, and Quality are substituted in the above equation and then reduced to their simplest terms the result is: OEE = Good count x Ideal cycle time / Planned production time We have seen how the OEE is calculated, now we can review each type of loss and its relationship to Major goals to improve OEE is to reduce the 16 Major losses, 16 Major losses are given below for reference, Capturing the Losses precisely will provide insights to act appropriately to improve the OEE. Similarly, Inaccurate capturing or not capturing of losses correctly leads to inflated value of OEE. Example: In Manufacturing process, Equipment loss is availability loss. Equipment failure may be due to following reasons like, - Tooling failure - Breakdowns, and - Unplanned maintenance. But in-correct capturing or tracking of above details may give more or inflated value in Availability time. In-correct capturing or recording happens due to following reasons. o Improper training or No Training o No clarity in recording of data. (Like Machine stoppage and Measurement and Adjustment losses recorded in Machine stoppage) o No proper SOP o No Real time capturing of machine running and stoppage details. o Complex way or No way of capturing and recording of details. Solution: 1. Policy can be set in SOP. Like any downtime longer than two minutes should have a reason associated with it shall be considered Equipment Failure. 2. Real time capturing of Machine stoppage and running time, etc., Real time capturing will give accurate details to capture availability. – Appropriate mechanisms or software’s can be fixed in machines to capture these data. 3. Training of Operator’s, Supervisors and concerned personal’s on Procedure’s Ø How to record the data? Ø What to record? Ø Which type of losses? Ø Friendly Data sheet used to capture the losses? Etc., 4. Visual Work instruction/SOP in workstation. 5. Wherever possible, Optimum conditions needs to be set. Eg: Machine Speed, changing of tools using SMED, etc., Thus, by recording and capturing the details accurately leads to Perfect calculation of Availability and provides correct OEE calculation.


-
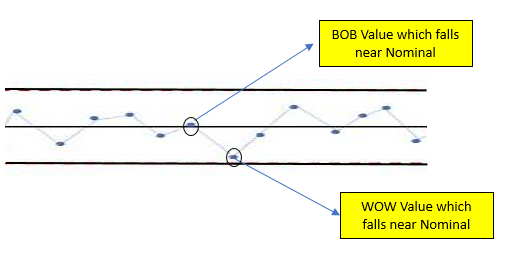
In General, When Something is mentioned as Best of the Best means “that it is of the Highest Quality, excellent or Highly desirable type.” In Process excellence the BOB can be explained in such a way that, In a Controlled Process, if the value of specific dimension plotted continuously in a control chart the plotted distribution goes up and down from the nominal. While this degree of variation will naturally occur in a process which is called common-cause or Natural variation. But still Process owners can make use of this opportunity to study why the reading is not very near to Nominal always. From this we can understood that the Values which is very near to the Nominal are BOB (Best of the Best) and values which are extreme from the Nominal are WOW (Worst of the Worst) Example: In Bi-lateral tolerance, if we take a nominal value this is called Best of the Best value (BOB). Consider the specified value 85.50+/-0.3 Here the USL (Upper Specification Limit) is 85.80 And LSL (Lower Specification Limit) is 85.20 And the Nominal value is 85.50. Hence BoB (Best of the Best) value is 85.50 In Unilateral tolerance, Consider the Value 20.00+0.000/-0.004 Here the USL (Upper Specification Limit) is 20.000 Here the Nominal value is the Highest limit of the dimension i.e., 20.000 Hence the BoB value is 20,000 All the Process owners desire to achieve BOB in their process and WOW (worst of the Worst) being the opportunity to evaluate the process. The process must be studied thoroughly why the BOB and WOW occurs. In Continuous Improvement, if we capture these values in exact process conditions it gives us thorough understanding of the process. also, it provides insights on variable and constant parameters to be maintained, in order to achieve the best BOB value in the process. Based on this data, we can understand which parameters can be tuned to achieve the BOB value. Tools like DOE can be used to screen and optimize these variable parameters. Note: Other factors like Process cost, Pricing and End user product criticality, etc., also needs to be considered while optimizing the BOB value.
-
The Critical elements to focus for Successful Six Sigma implementation journey is, 1. It needs to have a Top management support and an effective organizational structure. 2. As a next step, Six Sigma needs to become a business process management system that Understands and addresses process components and boundaries 3. Identifies and collectively utilizes process owners, Internal customers and External customers, and other stakeholders. 4. Creates an environment for effective project management where the business achieves maximum benefits. 5. Establishes project measures that include key performance metrics with appropriate documentation. 6. Tools like Force field analysis can be conducted to identify the driving and restraining forces. 7. Action plans need to be created to solve the restraining forces. 6. Projects needs to be focused on areas that can yield a high ROI and address the needs of customers. Master black belt need to Function as change agents and Conduct and oversee training like, • Training plan to Coach black belts/green belts. • Leverage projects and resources. • Formulate project-selection strategies with steering team. • Communicate the S4 /IEE vision. • Motivate others toward a common vision. • and to approve completed projects 7. Project black belt implementers are typically expected to deliver annual benefits of between $500,000 and $1,000,000, on average, through four to six projects per year. 8. The value of maintaining and improving customer satisfaction must not be overlooked by organizations. 9. To achieve success, organizations must wisely address Six Sigma metrics and its infrastructure. 10. The success of Six Sigma is linked to a set of cross functional metrics that lead to significant improvements in customer satisfaction and bottom-line benefits. 11. Companies experiencing success with Six Sigma have created an infrastructure to support the strategy. Tools like Affinity diagram can be used for grouping of issues that a team believed was important to address when creating a six-sigma business strategy. The interrelationship diagram also can be used to further subdivision of issues and to show the interrelationship of these issues, Ø Executive leadership and involvement Ø Delivered results Ø Customer focus Ø Strategic goals Ø Project selection Ø Training and execution Ø Resources Ø Black belt selection Ø Communications Ø Culture Ø Metrics 12. Roles and responsibilities need to be addressed for Executives, Steering committee, champion, Black and Green Belts. Etc.,
-
Cp is Potential of the process and Cpk is process capability index, i.e., Location of the Process. In the above process Cp=1.33 and Cpk=1.11 and Capability Ratio Cr=0.75 Since Cp is 1.33 and Cr = 0.75, The process is capable with strict monitoring. Cpk(Lower) is 1.55, the process center slightly shifts to the lower side which has to shifted to center as nearly as possible for having better Cpk near 1.33 Also reducing the spread, improves the Cp and decreases the Cr Value, which give Robust process.