Mayuri Kokkula
Members
-
Joined
-
Last visited
Everything posted by Mayuri Kokkula
-
ACPT (Agent, Customer, Process, Technology) Agents: These people interact with the customers and customer services. There are many reasons for customer dissatisfaction, a few among them are rudeness, not having product knowledge, customer associates not providing the correct information, not having the category-wise addressed concerns etc. But all these can be improved by providing training to the customer associates. Customers: These are the people who avail the services. Customer dissatisfaction might not only be due to the above-listed examples but also might be due to bad experiences in the past. Process: Due to the process limitations, the customer service agents might not fulfill the customer's requirements. This may lead to customer dissatisfaction. One must identify and address these customer dissatisfactions. Technology: This is related to the technical issues that customers face during the usage of the product. This also would lead to customer dissatisfaction. ACPT can also be used in US Healthcare Industry: · US healthcare is all about the 3Ps - Providers (Hospitals), Payers (Health Insurance Companies) and Patients. · The Patients avail hospital services from the Providers (Hospitals), and providers submit claims to Payers (Insurance companies), Insurance companies pay to the providers based on the plan agreement. The patients pay to the health insurance companies in the form of premiums. ACPT analysis in US healthcare Industry: · Agents in US Healthcare: These are the people who interact with the patients to collect the balance bills, to help the patients in filing appeals/disputes with the providers. · Agents who collect balance bills are the providers (Hospitals). The billing departments in hospitals will call members and send emails to collect payments. Patients can request for the billing statements and Itemized Bill statements. · There are few Third Parties (TPs) who help patients in filing disputes with the providers on behalf of Members. TPs have their unique way of addressing patients and filing disputes. · The TPs maintain good relationships with the patients. · The TPs will contact patients in a timely manner. · TPs acknowledge every communication from patient and have predefined process in place. · The TPs will work to satisfy the patients by helping the patients not pay the additional balance bill. · The TPs measure the customer (Patient) satisfaction and implement special packages to satisfy customers (patient). · TPs have two-way communication with the patients. One way will be through the phone calls and the other way through emails. · Patients can call TPs to inquire about their claim’s status, about the dispute status. Customers in US Healthcare: Customers are the patients who avail the services from Hospitals. The common questions asked by customers to the billing departments of the hospitals include– 1. What is this bill for? 2. Does this balance apply to my deductible, coinsurance, or copayment? 3. Did you apply this balance against my secondary insurance? 4. Why didn’t my insurance carrier cover the charges? 5. Can I enroll in a payment plan? Process in US Healthcare: · Let us consider the process of Accounts Receivables (AR) calling centers work for both Out of Network (OON) and In-network (INN) providers (hospitals). o OON – Providers who have contractual agreements with the insurance company. o INN - Providers who Do not have contractual agreements with the insurance company. · There will be a process flow to reach out to insurance companies (Payers) as well as Patients. · Agents must follow as per the process and are not supposed to skip any of the steps. · For Example - Process steps for OON include 1st call will be made to the insurance company by the providers to let them know that the provider is OON with the Insurance and demands for the complete payment of the services provided to their insured patients. · The providers ask the insurance companies to reprocess the claims and send in the additional payments. · If the insurance company denies the claim, the provider has a right to appeal and get the payment. If the insurance company does not pay the additional payment, the providers inform the insurance companies that they will be billing the patients who availed the services. · Here the patients will be billed for the rest of the amounts, and this might lead to the patient dissatisfaction. Patients get scared to pay the hospital bills apart from their allowable amount (copay or co insurance). · If the providers improve their way of collecting payments from patients, then there will be a good relationship between them. Minimizing Patients Dissatisfaction · The providers must follow the US healthcare guidelines to get the claim paid instead of getting denied. · The Providers should be transparent to patients and should disclose all the financial details at the time of registration. This way, one can refer to the agreed breakdown if issues arise. 1. Offering Patients a Payment Plan: · If the payment takes too long it might lose value, so by offering a payment plan (weekly/monthly instalments) not only allows you to steadily recover your bill, but also enables the patient to reduce their debt. Additionally, refusing medical care due to expenses might prove unsuccessful to your patients. A payment plan option will therefore increase their access to care. 2. Make Post-visitation Calls: · Making calls to the patients for bill collection will be easy but the patients should be addressed with courtesy and care. · Providers must ensure that the bill has the necessary details, such as the name of the provider, the location, the care provided, the amount paid by insurance and outstanding expenses, including the date you provided the service. These steps will help to reduce questions and create a better response to the debt. 3. Providing Flexible Payment Options: · Providing multiple payment options like online payments, which include payment through phone calls, payment through emails and help in receiving faster payments. The providers can remind about the payments through text messages, phone calls and gentle email reminders. 4. Training Front Office Staff: · The front office staff might feel difficult to request payments from patients. Train the staff in effective communication techniques. This will enable them to request payments in a manner that is less likely to damage the relationship. Be sure to provide adequate monitoring such that requests align with best practice standards. 5. Using a Practice Management Software: · If the financial system is automated, then it will enable to keep a track of debt and alert patients on due dates. Technology in US Healthcare: The patients experience issues in the billing. The billing dashboards might not display the correct payments sometimes. Misallocation of payments will be made between 2 dates of services. The payments get reflected within 30 days from the payment date. How to minimize Technological issues: · The providers must have a strong billing dashboard helping patients to access the information whenever required. · The providers should respond to the patients’ queries within 24 hours. · The providers should have a business analytics team to project the patient’s data effectively. · Providers should implement cyber security. · The providers should comply with the HIPAA rules.

-
Real-Time Analytics Traditional Analytics Definition The process of preparing and measuring the data after the data enters the database is called Real-time analytics. It allows organizations to quickly respond to changes in the market and operational issues. It also allows organizations to prevent problems before they occur. Traditional analytics is dependent on historical data which can be days old. Processing Speed As soon as the data enters, it gives us information on the occurring events. It involves batch processing. Here the data is collected and stored and then analyzed in scheduled intervals. Response Time It allows for timely decision-making The response may be delayed which might in turn lead to missed opportunities Effectiveness of data It provides us with the most recent and accurate data for real-time analysis It deals with historical data which might not give us the exact picture of the current state. Requirement To provide the most recent and reliable data, it requires specialized infrastructure. It uses the existing databases. Nature of Complexity It is more complex as it manages high volumes and real-time data It is easier and simpler to manage.
-
Management By Objectives: It is a strategic management used to improve the performance of the company by clearly defining the objectives of the company by both the management and employees. It focusses more on the results rather than the activities involved. In this, the Manager and employee decide a specific goal and then decide a plan to achieve it. It enhances employee participation and commitment. There are 6 steps in MBO: Define Objectives of organization: Involves all the employees and looks at the day-to-day activities and it focusses on answering the question ‘what are we trying to accomplish’ Define objectives of the employees: Clearly deliver the objective of an employee. Encourage employees to participate. Monitor Progress: It ensures that action plans are working. If goals are not being met, we can change the action plans. Evaluate performance and reward achievements. Looks at individual and overall company’s performance. Feedback: Giving Feedback after the performance review. Advantages: · It helps Managers to easily achieve the best results. · Employee commitment · Based on performance reviews, management can plan for training programs · Delivers more certainty in the management in managing a task. Disadvantages: · If the Manager does not have a proper understanding of MBO, then it may fail. · Goals should be SMART. If the goal is difficult to achieve, then it decreases the employees' confidence. · Setting goals is time-consuming and requires lot of study and experience.
-
Predictive modeling is a statistical technique to predict future behavior. Its solutions are a type of data mining technology. It analyzes historical and current data and generates a model to predict future outcomes. It is used to predict customer behaviors, Financial, economic and market risks. There are different Types of Predictive modelling: · Classification Models: This type of model uses machine learning and places data into categories. These are of several types, few of them are: o Logistic regression - Yes/No estimation of future events o Decision Trees – in addition to yes/No decision, it deals with if/else to predict future events. o Random forest – it combines unrelated decision trees using classification and regression. o Neural networks – Large volume of data is reviewed to reveal correlation. o Naïve Bayes: it is based on Bayes' Theorem, which forms conditional probability. · Clustering Models: In this model, the data points are grouped. According to this model, the data in one group should have similar characteristics when compared to the data in different groups. Below are few of the clustering models- o K-Means: This model identifies central tendencies of different groups of data. o Mean-Shift: In this model, the mean of a group is shifted. · Outlier Models: The data always has outliers. The outliers are identified by the following few algorithms: o Isolation Forest o Minimum Covariance Determinant (MCD. o Local Outlier Factor (LOF) · Time Series Models: It uses historical data to predict future events Below are few of these models: o ARIMA: uses autoregression integration and moving averages to predict results. o Moving Average uses an average of a specified period. Advantages Of Predictive Modelling It is an easy way to generate actionable perceptions. It is used to test different scenarios. It increases the speed of decision-making. Disadvantages Of Predictive Modelling Calculations cannot be explained. Bias due to human input High learning curve
-
Triple Bottom Line It is a business strategy focusing more on measuring social and environmental impact than measuring financial growth for generating profits. TBL can be split into 3 Ps. Profit – The profits generated by the organizations to their stakeholders. People – organization Impacting society in a positive mode. Planet – organization impacting the environment. How to Measure the Triple Bottom Line Businesses may have to come up with innovative ways to evaluate their triple bottom line. While conventional accounting principles offer clear instructions on how a company should document its accounting revenue, there may be little or no framework in place for measuring its triple bottom line. This is especially true since there may be no mandatory external reporting requirement. Measuring Profit A company usually reports its company-wide net income as part of its triple bottom line. Among the three components of the triple bottom line, profit is the easiest to report because it already has strong guidance. In addition to profit, a company may also report or highlight other financial metrics such as gross margin by geographical region to demonstrate consistent or equitable pricing across different demographic groups. Historical federal income tax payments can also be reported to demonstrate the company's effective tax rate. Finally, a company may report any historical information or lack of late payments or penalties as a demonstration of its financial responsibility. Measuring People The "people" aspect of the triple bottom line is also known as social measures or social metrics. It includes both financial and non-financial measurements that can be determined by generally accepted accounting principles (GAAP), other reporting rules, or internal data sources. To measure the people component, some examples include the average employee payroll, which can indicate if employees are receiving livable wages that exceed local pay expectations. Average employee benefits per employee can show the full benefit package per worker, and the average number of vacation hours earned and used per employee can demonstrate whether workers have been able to take time off. In addition to this, employment demographics, such as the proportion of employees in different age, race, sexual orientation, or religious groups, can be measured. However, it is worth noting that some of this information is sensitive and must be provided voluntarily by employees. In the case of vendor demographics, businesses can identify themselves as small, LGBTQ-owned, veteran-owned, or minority-owned. Measuring the number of product returns across different geographical regions can help ensure that customer satisfaction remains high among all demographics.. Measuring Planet One of the most challenging aspects of the triple bottom line is measuring its impact on the planet. A company needs to measure its existing impact on the environment as well as its "eco-friendly" impact, which may require considerable expertise or effort. However, there are some common environmental measurements that companies can use to assess their impact, such as: - Reductions in greenhouse gas emissions based on the difference between former processes and forecasted changes in new processes. - Amount of waste generated in pounds, including the amount of recycled product over a period of time. - Amount of energy consumption, adjusted for seasonality. - Amount of fossil fuel consumption (adjusted for per-employee or per-sales lead if the company is growing). - Proportion of raw materials sourced ethically. Advantages · Encourages employee retention and decreases attrition. · Creates favorable working conditions. · Results in increased long-term profitability. Disadvantages It will be difficult to measure certain social and environmental aspects. Profitability, which is quantifiable and is easy to measure but the social and environmental factors can be hard to quantify. Balancing competing priorities, such as maximizing financial returns while also doing what is best for society, can also be challenging.
-
The thought of shared services had started in the 1980s. Large organizations which possess multiple businesses found alternate ways to reduce costs. Shared services is a centralized unit of an organization which manages the back office tasks. Finance and HR departments are mainly included in shared services and a few other departments also use the concept of shared services. The difference between shared services and outsourcing is the former is an internal business concept and the latter is external business concept. The advantages of shared services include: · Higher expectations in business setting · It motivates businesses to control and reduce costs. · It helps in changing business needs.
-
Value chain Analysis concept has been developed by Michael Porter. When a product moves from one department to another, its value increases. Using the concept of value chain analysis, the business can be divided into Value adding and non- value adding activities. VCA includes both qualitative and quantitative approaches. To conduct a value chain analysis, businesses need to split the chain into 2 levels- Primary activities and Supporting activities. Primary activities include inbound/outbound, operations, sales, and marketing services. Supporting activities include R &D, technology development, HR management etc. Example: 1 Value chain Analysis for a Hotel: Primary Activities Supporting Activities Site Selection and construction Accounting Reservations Hiring and training Operation of hotel properties Advertising; building a brand and reputation Managing of hotel location General administration Process Mapping: Process mapping allows the team to represent the process associated with their problem in such a way that others find it easier to understand and make the job of defining current process easier · It also helps people to understand where the waste exists in the process and where the process. has been poorly defined. Process maps can be analyzed for: o Time-per-event (reducing cycle time) o Process repeats (preventing rework) o Duplication of effort (identifying and eliminating duplicated tasks) o Unnecessary tasks (eliminating tasks that are in the process for no apparent reason)
-
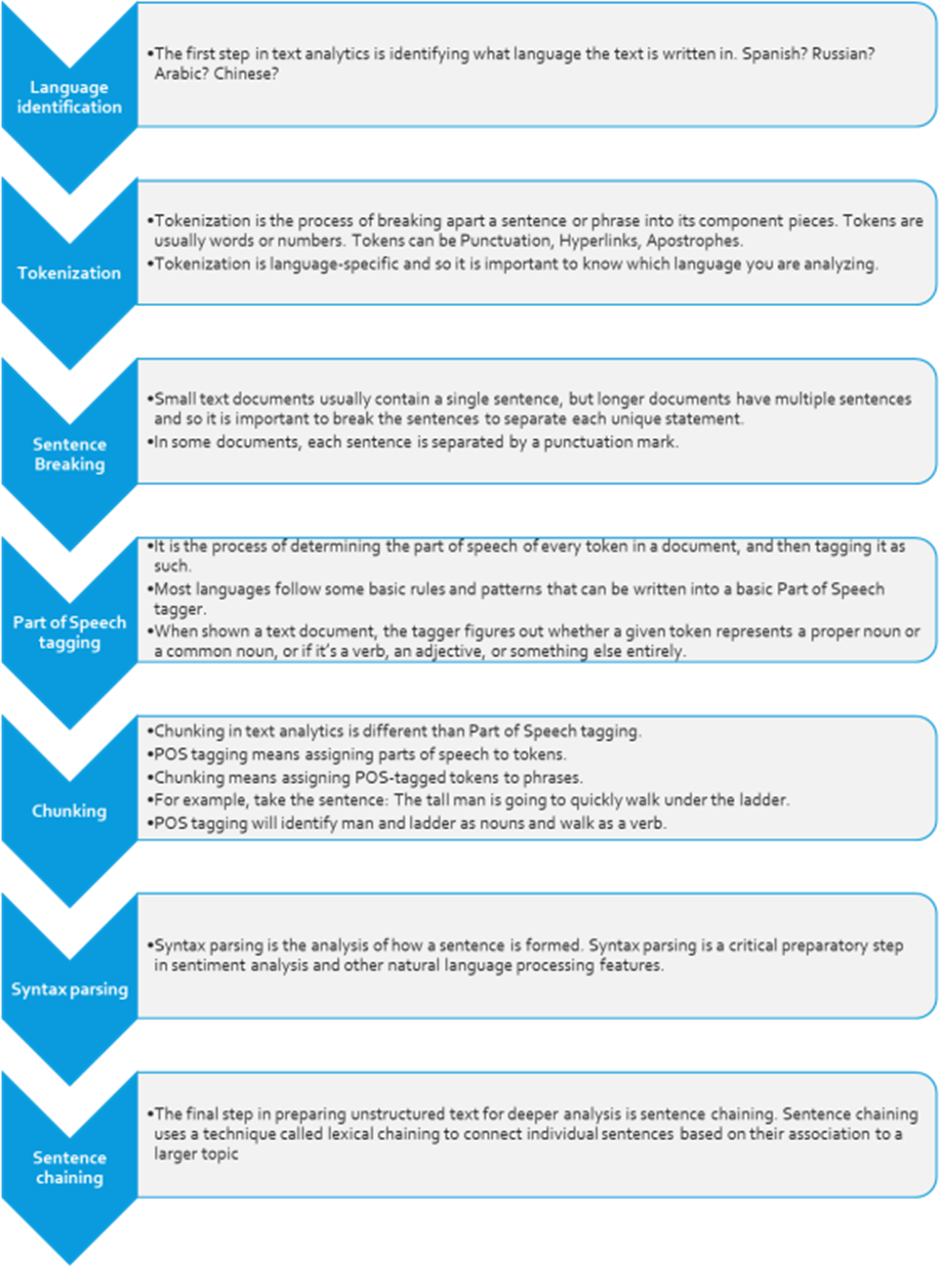
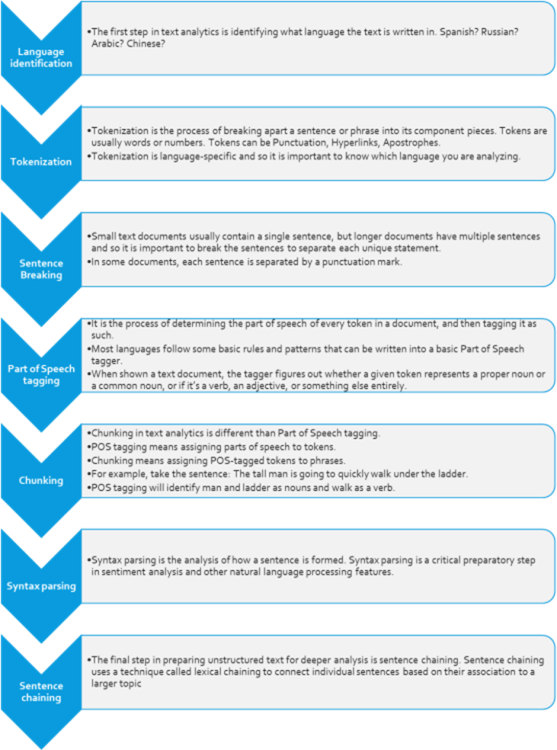
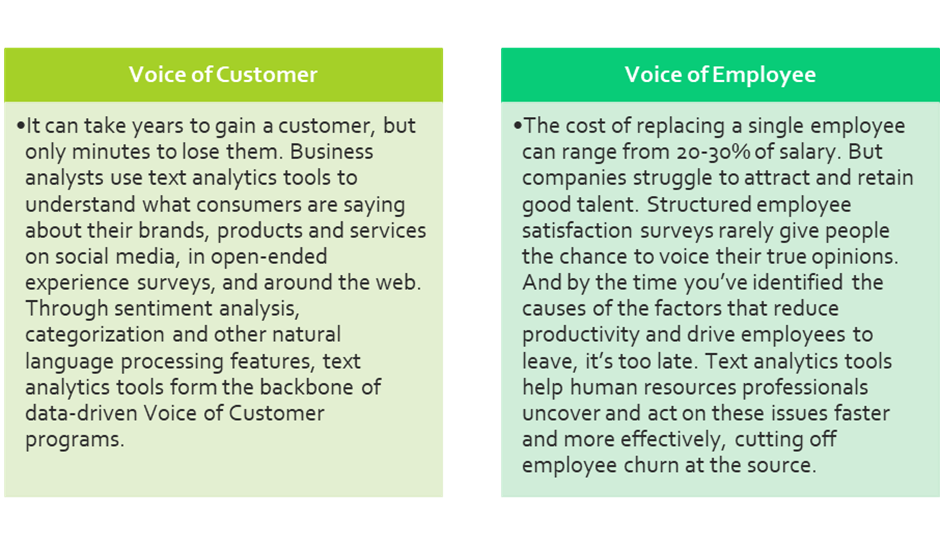
What is Text Analytics: Text Analytics is nothing but the automated process of collecting the large amount of unstructured text data and converting it into usable structured data. Differences between Text Mining and Text Analytics: Applications of Text Analytics: Text analytics is used in the below fields: Steps Involved in Text Analytics are shown in the below screenshot: 1. Language Identification 2. Tokenization 3. Sentence Breaking 4. Part of speech tagging 5. Chunking 6. Syntax Parsing 7. Sentence Chaining Impact of Text Analytics in VOC and VOB


-
What is a Risk Register: It is a mandatory tool that a Project Manager should have or maintain. A risk register is also known as Risk Log. It is a tool and central repository that Project Managers create and use to track and monitor any risks that might impact their project. A risk register is used both before and during a project. It allows a Project manager to plan and strategize on any potential problems or setbacks that arise on a project and help plan an effective risk management strategy. Purpose of Risk Register: The purpose is to identify, log and track any project risks. A risk is anything unexpected that could happen, that would positively or negatively impact a project. Logging risks help to understand the severity, make stakeholders aware and ensure prioritization is in place for such risks. Why do we need a Risk Register: We need a risk register because, as projects get larger, longer, and more complex, it becomes increasingly difficult to manage. If risks are not tracked in a central repository and reviewed regularly, risks can develop, get worse or cause a larger impact. Some risks may seem negligible or unlikely to occur but have the potential to impact a project and have a knock on effect. Effective risk management is about identifying possible problems sufficiently early to plan the response and approach. It also allows a project manager to monitor risks over time and see how they progress. Risks are categorized into 2 types: Qualitative Analysis: In this, we prioritize the risks based on the probability and impact of the risks. Quantitative Analysis: In this, we analyze the effect of risks on the project. Examples of risks: Data breach Catastrophic event. Service outreach. Supplier goods go into liquidation or cease trading. What does a risk register look like? A risk register is essentially a document that lists all the risks and provides key information again each one. Risk registers are usually populated in spreadsheets. Columns in the risk register: Unique risk identifier - is the number to quickly refer to each risk. Risk Name – Name of the risk. Description - Enter the description of the risk. Risk category: It explains the type of Risk (social risk, economic risk, technological risk, environmental risk, security risk etc.) Probability – it explains occurrence of risks. Impact –analyze the potential impact of risk in this column. Risk Mitigation – Enter risk response plan. Priority – Level of risk compared to others (Low, medium, high) Responsibility owner – Person responsible for risk management and overseeing the solution. Status – Progress of the risk mitigation plan (Open, In progress, closed) An effective risk register is: One that is routinely updated, reviewed and easily accessible by project stakeholders. Can be filtered easily, to allow certain risks to be more easily monitored and understood. Where probability and impact can be realized and prioritized.

-
Process Benchmarking is a technique of generating solutions. It is used when the focus is on improving detailed critical processes and operations. Partners are sought either internally or externally from best practice organizations that do similar work or deliver comparable services by selecting the problem which we want to solve in the process, then by mapping the actual present process. Next is to check and find out which are the companies or competitors doing the same type of business and doing better, then planning for the benchmark visit in the industries selected by the above process. The final step is to analyze the process of benchmark company & good points in own process, finalize the targets.