Thomas Knaeps
Members
-
Joined
-
Last visited
Everything posted by Thomas Knaeps
-
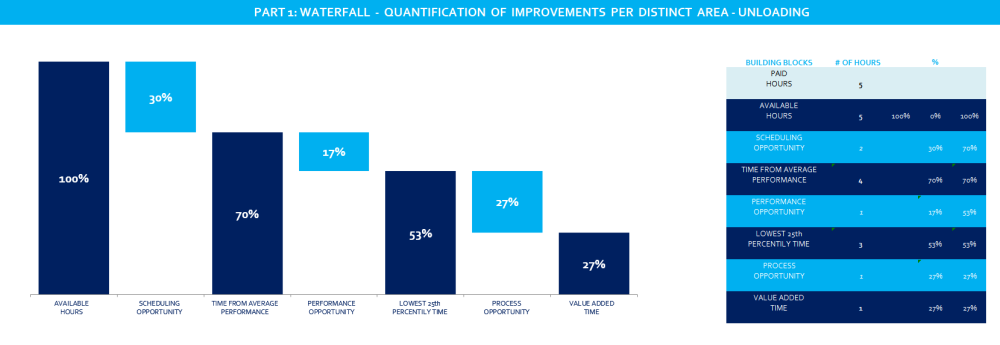
Hi all, See attached picture. For getting this, we need to do manual measurements in order to find scheduling, performance and process opportunity. We are looking into a way to make it more pragmatic and let the warehouse do measurements themselves. But then it needs to be very clear and straightforward. And when we have the data, we need to get the graph in attached example out of it. I was wondering if there are any tools available or any advice in general? I know my question is pretty wide, so maybe some further clarifications will be needed, but let's start with this. thanks, Thomas