

HariShankar
Members
-
Joined
-
Last visited
Everything posted by HariShankar
-
MBO [Management by Objectives] is a top-down approach in the management strategy where the Vision, Strategy and Goals will be clearly defined by the Top Management. The MBO has six steps 1. Determining Organization Goals – Top Management sets out the strategy roadmap for the organization with goals categorized under Short term, medium term and long-term goals 2. Determining Employee Objectives – Basis the goals of the KRA’s for each function and process is percolated by the Top Management to the Middle Management 3. Monitoring Progress & Performance – Periodic Performance Discussion sessions are facilitated to track and monitor progress and performance 4. Performance Evaluation – The performance is evaluated every 3-6 months period basis the goals and improvement plans are put in place to keep up the performance 5. Providing Feedback – Feedback sessions are an integral part of the performance evaluation and they help to ensure whenever a dip in performance is addressed with the right remedial measure 6. Performance Appraisal – Periodic Performance Appraisals are performed to ensure employee motivation and help to achieve organizational goals and objectives On the other hand, Six Sigma as a methodology has some principles which complement the MBO and if they are put together in practice will yield greater results. In my opinion below are my thoughts on how Six Sigma principles can be integrated with MBO 1. Customer Focus – Any organization whilst defining an organization goal or strategy will keep the Customer focus as a primary objective which can be measured through NPS. In addition the Customer focus will be a part of the employees objectives as well as a KRA 2. Map VSM to discover the problems – Unless we implement a proven methodology like VSM to map the end-to-end process we won’t have visibility about the NVA which consumes time and effort but doesn’t provide any yield. This will align with Monitoring the progress where VSM can play a key role in identifying where the progress lags and how we can bring it back on track 3. Once VSM is completed the variations must be removed as they consume unnecessary bandwidth which can be repurposed to other priority areas and this will be aligned with the Providing feedback stage in the MBO 4. Communication is key in Performance evaluation and providing feedback has to be an iterative exercise in an organisation 5. The organization has to embed a culture of flexibility across its resources to meet the organizational objectives
-
Predictive Modelling is a widely used technique in the field of AI/ML by organizations to predict the future outcome of a process/ service across industries. It predominantly uses historical data, identifies patterns and uses Machine learning models like Ensemble Techniques to predict a future outcome. The output can be further analyzed to proactively take measures to avoid an impact. Some of the examples where predictive modelling is successfully implemented are 1. Banking – To identify defaulters to repay loans 2. Telecom – In the Network monitoring area to identify failure of active/ passive infrastructure 3. Healthcare – Identify the critical illnesses in the patients 4. IoT/ OTT Platform – Proactively suggesting content-based user preferences and usage 5. Agriculture – Predicting the soil fertility, crop growth harvesting and weather patterns Here are my thoughts on how Predictive modelling can be used to predict process behavior. A process is a step-by-step procedure or a set of activities that need to be executed either in sequence or parallel that results in the delivery of a service or the creation of a product. The Process involves three critical components People, Procedures and Platforms. People – The resources who are involved in delivering a service or the creation of a product Procedures – The documentation the people use to deliver a service or a creation of a product Platforms – The tools and applications that are involved in delivering a service or a creation of a product All the above three involve and generate a large amount of data which is a vital part of Predictive Modelling or Predictive Analytics. Here are some examples of how Predictive Modelling can help predict the process behavior People: This component has a great influence on delivering the process successfully, Predictive Modelling can be implemented in the following areas to predict the Process Behavior in any BPO/ KPO 1. Process Quality – Based on patterns we can predict when a process can have quality issues in the production like when there is an increase in complex orders, changes in the resource skillset 2. Attrition – Based on skillset and the demand in the market we can predict the attrition patterns which could impact process failure 3. Knowledge Retention – Based on volume patterns we can predict the need to cross-functionally train resources for effective utilization, for a short period we can’t onboard resources where cross-functionally trained resources can meet the demand Procedures: is very vital to deliver a Process on time with quality. Here are some examples where a Process Behavior can be predicted using Predictive Modelling 1. Failures – Using historical data like volume and quality we can predict when a process could potentially fail due to the lack of procedures like un-updated SOPs 2. Change – When a process could require a change like the need for process re-engineering to revise a benchmark and update procedures Platforms: is technology driven and would be constantly upgrading as the technology evolves. To study the Process Behavior Predictive Modelling can be implemented in the following areas 1. Uptime – The Customers are constantly expecting the services to be available round the clock, Predictive modelling can help to predict how platform-related failures can be eliminated that could impact a Process 2. Consolidation – When the platforms can be consolidated to achieve process efficiency
-
Vertical Integration It’s a business strategy where the organizations would be keen to integrate the business functions which were dependent on suppliers to 1. Improve the quality 2. Optimize cost 3. Gain control of the market power and market share 4. Expand its reach to the end customers/ consumers Vertical Integration is of the following types Backward Integration: In this strategy, Company A integrates the upstream processes in the supply chain function, this helps them to gain more control over the inventory, and procurement of raw materials all the way to the manufacturing of the raw materials. 1. Reliance Industries is a classic example of Backward Integration as they were originally in the textile industry from which they entered precursor chemicals, plastics, petrochemicals, petroleum refining and finally oil and gas exploration and production. 2. UK Supermarket chain Tesco took over the Booker Group which was the UK’s leading Food Wholesaler. This gave Tesco additional access to become a major supplier to competing small retailers, serving 125,000 independent convenience stores as well as 468,000 restaurants and pubs Forward Integration: In this strategy, Company A integrates the downstream processes in the supply chain. This will give them an extended reach to take control of the distribution, sales and post-sales services of their product/ service. 1. Telecom giant Airtel is to acquire ~97% stake in the Beetel Teletech a company that manufactures landlines and cordless phones 2. Dell successfully manages the sales and distribution of their products without support from any partners as it gives full control over owning the services to its customers and consumers Balanced Integration: In this strategy, the company decides to pick up both the upstream and downstream activities in the supply chain. This enables it to be in a strong position to source raw materials, design, develop, manufacture and manage the post-sales 1. Apple is a classic example of balanced integration as it has tight control over sourcing the raw materials, manufacturing chips, opening its retail stores and managing post-sales service 2. D Mart is another successful organization that had successfully implemented the balanced integration as it helped them to gain a significant market share in the hypermarket chain Impact on Business Excellence Strategy The business excellence strategy will have to be realigned to consider vertical integration. The company that performs the Vertical Integration will have an upper hand in defining, formulating, implementing and governing the business excellence roadmap for the combined organization. Below are the key priorities in such instances 1. Define and achieve economies of scale, expand foot print 2. Relook at the Cost structure as some of the fixed costs will now be variable costs, greater scope for implementing cost avoidance/ saving projects 3. Cross-skilling of resources and redeployment of resources 4. Consolidation of Tools, inventories and platform Improve Employee and Customer Satisfaction levels
-
Shared Services The Shared Services Centre is a delivery unit that’s created with a primary focus on optimizing costs in an organization. This unit helps organizations achieve their strategic objectives by playing a pivotal role in planning, designing, and implementing the initiatives. The SSU operates with the 3 key pillars focusing on 3 major themes as listed below. Pillars People Process Platforms Collaborate · Bring people together · Align to achieve a common goal · Brainstorming sessions · Discover Best Practices · Learn, Unlearn and Relearn · Visibility of Multi-geography tools and applications Consolidate · Resource dimension and allocation · Cross-train colleagues · Create a talent pipeline · Implement Simplification (Do More with Less) · Create process repositories · Explore the integration of applications to achieve efficiency and cost benefits Convert · Upskill people by adapting to newer technologies to meet transformation goals · Implement a Continual Service Improvement Framework · Simplify and Automate Whilst SSU is predominantly a Cost Centre it does have a scope to implement projects that generate revenue. Let’s look at an example. Scenario 1: A global telco that has a captive shared services unit has the potential opportunity to improve revenue generation Function Primary Objective/ deliverable Improvement Initiative Benefit Sales Support Tele calling – Manage CRM and close calls within agreed SLA Use AI/ML systems and segment the customer and pick up the leads that helps to improve the closure rate Improves conversion % which increases sales Service Delivery Deliver Service to the customer within the agreed SLA Through automation and lean framework optimize lead time that helps earlier activation Increases revenue through early billing Service Assurance Closure of open tickets for faults within the agreed SLA Any lead optimization in faults will help to increase revenue and customer satisfaction Increases revenue and customer satisfaction Scenario2: A global telco that has niche skills in the sector has a captive unit to manage the services whilst the excess capacity of resources can be effectively utilized by enabling a delivery unit that can serve global telcos through an Offshore unit serving as a Subsidiary. In this approach, the SSU will also help to generate incremental revenue with good margins as they are monetizing their niche skills to serve it’s customers
-
Horizontal Integration It’s a business strategy for growth where companies either take over, merge or aim for expansion internally. Any of these upon successful implementation will result in 1. Increased market share 2. Balances competition 3. Enhanced product coverage and growth 4. Improves Customer Satisfaction Take Over: In this strategy, Company A takes over all the activities of Company B including the customers of Company B. In the telecom industry in India during the period 2010-20 a bunch of new entrants were acquired by the large players as they couldn’t sustain the competition which involved huge investments to roll out as well as maintain the existing network. Without maximizing revenue investments became a huge question 1. RCOM acquired SSTL 2. Jio acquired the assets of RCOM 3. Bharti Airtel acquired Loop Telecom 4. Vodafone acquired C&WW (Cable & Wireless Worldwide) in the UK Merger: In this strategy Company A merges with Company B and both jointly operate to deliver the services/ products to the customers. There is a clear demarcation of powers defined by the % stake one owns in the merger. There are quite a few examples in the telco domain again 1. Vodafone Merged with Idea and jointly operates under the brand VodafoneIdea 2. BT (British Telecom) and EE merged and operate under the brand BT EE they provide wireline and wireless services in the UK 3. Virgin Media and O2 merged and operate under the brand VMO2 and provide wireline and wireless services in the UK Internal Expansion: In this strategy, the company decides to deploy capital to expand horizontally create value for its customers, generate revenue and minimize dependencies on partners. Again there are quite a few examples in the telco space 1. Jio started as a telco and deployed fibre to deliver wireline and wireless services how ever invested heavily in expanding horizontal services under Jio Consumer platforms which has a. Jio Money b. Jio Apps and Jio TV c. Jio Mart d. Jio Sign 2. Airtel investing heavily in the data centre business under the brand Nxtra Data Impact on Business Excellence Strategy The business excellence function will be realigned towards the new organizational strategy, the existing projects/ initiatives will be reprioritized and more importance will be given to 1. Ensure the combined business builds and gains momentum 2. Leverage the synergies between both companies, pick up the best practices from each other and enhance a combined learning 3. Define cross-functional and cross-company collaboration that helps colleagues to work towards a common goal 4. Define a transformation approach and drive the colleagues to contribute to the transformation goals In a situation where Company A acquired the Company B, there are higher chances to 1. Stall the projects/ initiatives of Company B as more focus and priority will be given to drive the initiatives which were up and running in Company A 2. Allocation of resources (Financial, people and logistics) to the existing initiatives under implementation in Company B
-
Standard Operating Procedure: The standard Operating Procedure is created when a new process/ product or service is introduced, this document captures the process step by step which helps 1. To train the new resources whilst onboarding 2. Refer and reengineer the process for continuous improvement 3. Conduct the touch time study 4. Calculate the effort estimate for resource and volume dimensioning The SOP is a part of the process repository and it isn’t a static activity, it’s a live document that needs updating throughout the process life cycle. Whilst it requires an intensive effort to update the changes to the SOP through a Change control process and publish the latest version for usage, a lack of updating the SOP will lead to process gaps and activities operating on a silo. When we have a large scale of resources operating a single process SOP becomes a holy book that can referred to at all stages. If an updated SOP isn’t available it will lead to the following challenges 1. Dip in resource utilization 2. Shortfall of throughput 3. Defects in delivery 4. Delay in delivery as lead time increases 5. Impacts Customer Experience Whilst everyone thinks Standardization stifles creativity, On the contrary, it could help in Continuous Improvement. It also has a ripple effect if you improve one variable it yields multi-fold benefits. For Example, A periodic review of the SOP in a brainstorming session will help to generate ideas. These ideas could be of various forms and shapes like improving touch time, eliminating repetitive steps, automating a monotonous activity, doing activities in parallel where there isn’t a dependency on one another etc. If any one of the ideas like improving touch time (for example) is implemented it improves 1. Throughput 2. Customer Experience 3. Revenue 4. Employee Satisfaction through rewards and recognition
-
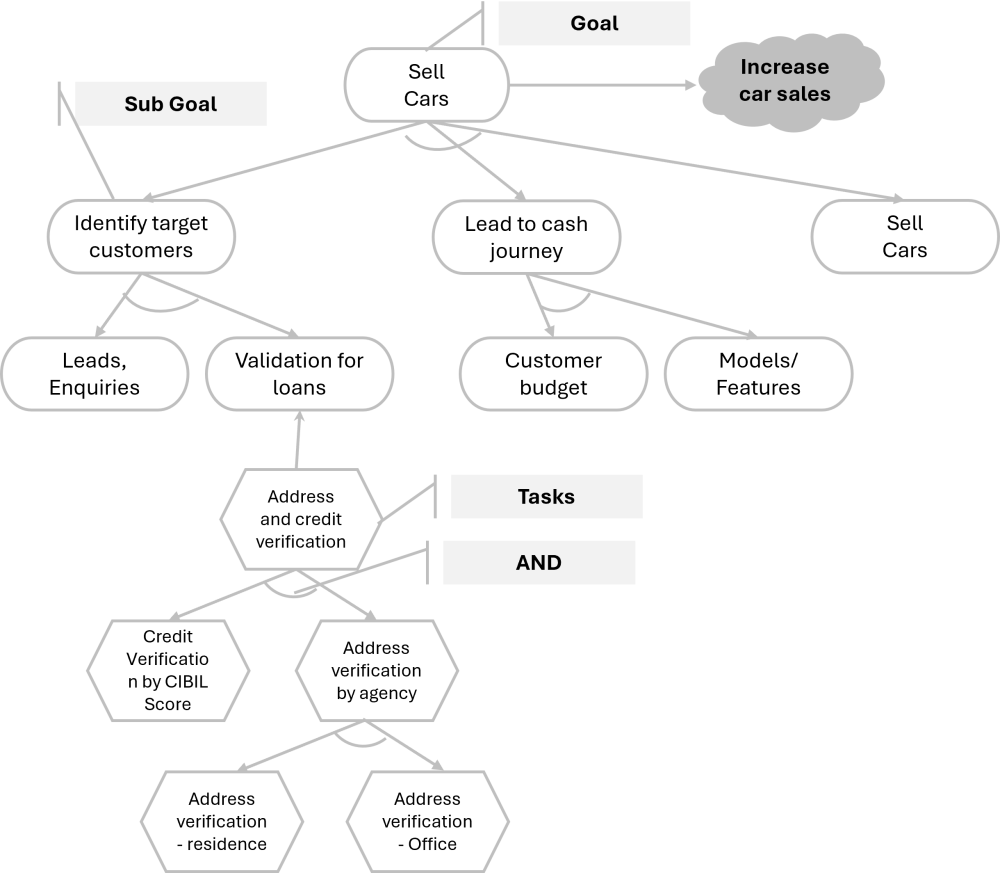
The Goal Mean Diagram is a graphical representation of the goals of a project, its relationships with the stakeholders (internal and external) and with the other goals of the project. It provides a big picture of the overall goals of the project whilst the other scoping tools like VSM, SIPOC, and Business process mapping provide some aspects of the goal mean diagram. For instance, the VSM mainly focuses on the value-added and non-value-added activities of the project whilst the SIPOC focuses on what we receive, what we do and what we deliver as an output to our stakeholders The Goal Mean diagram has the following elements: Goals: are the objectives or targets that an organisation has to accomplish over a defined period. The goals for which success criteria can be defined are referred to as hard goals whilst if we can’t define quantitative success criteria it can be referred to as soft goals. Task: is a set of activities or steps that need to be completed to achieve a goal Resources: are the tools, equipment, and personnel required to complete a task that helps to achieve a goal The goals are refined and analyzed using AND, OR & AND/OR breakdown AND: Defines the process to accomplish a goal OR: Defines the alternative decision to achieve a goal AND/OR: breaks down the goals into subgoals Below is an example of Goal Mean diagram for “Car Sales”
-
The Risk Register is a log of risks that has the details of all risks that have been identified along with their analysis and plans to treat the same. This log captures risks along with their severity and the actions and mitigation steps to deal with the risk. Criteria to add risk to the Risk Register. A. Identify the Risks – Perform a Risk assessment to identify risks. Collaborate with internal/ external stakeholders across the organization to hear what they believe the major risks are. Engage in a brainstorming session to generate inputs and leverage everyone’s expertise to identify potential risks in various areas of the organization. B. Define the Risks – Post identification of the risks, describe them with enough information for all team members to understand why the risk is included. C. Estimate the probability and impact – Basis the probability define and develop a strategy to deal with risks. Use the risk management methodologies to decide the likelihood of a risk. D. Create a Risk Response Plan - A response plan for each risk identified, described, and analyzed assures that the risk is managed effectively. Careful due diligence is required to be performed on all the possible risks identified. This provides an easy go-to document for the Risk Owner to refer to when a risk occurs E. Prioritize Risks - Risks with the highest likelihood and potential for impact in many areas will be given priority for mitigation and action plans. Each risk priority can be determined by combining the risk probability and risk analysis measurements Criteria to remove a risk from the Risk Register. Risks are closed when it’s · It has been accepted, · It’s caused a problem and is successfully mitigated · It’s no longer a risk to the project · Closing a risk has to be formally documented. Items for documentation should include any updates on risk information, closure rationale, and lessons learned. Whilst closing a risk the lessons log has to be documented with 1. The rationale, how it was mitigated or what conditions have been met, for closing a risk for future reference. 2. Provides a historical record of all risk management actions taken, responsible persons, as well as the cost and benefits of mitigation plans A Risk Register can be used in a process to track the following risks 1. Track the ongoing attrition 2. Delays in the Resource onboarding 3. Transactional volumes that relate with the revenue, lesser delivery of productivity leading to a dip in revenues 4. Higher resource costs leading to dip in the margin 5. Customer experience issues leading to a dip in the NPS
-
Process Entitlement is defined as the ideal state of a process performing at its optimal level in a BAU scenario without any changes over some time. It’s a powerful concept of Six Sigma that’s used to determine the level of improvement in a process and is widely used for project selection. Entitlement will be determined for all the key process performance measures in a process [Yield, Cost of Poor Quality, Capacity, downtime, rework, waste] Example: A process in a BPO is operating at an average of 700 calls per day. They were able to increase the throughput to 850 calls per day without any changes to the set-up and they were able to sustain it over some time. In this case, the entitlement will be 850 for the process whilst the average is 700 calls per day. They have a scope to improve by 20% at least Methods to Calculate Process Entitlement There is a 3-step methodology to calculate the process entitlement Align: The process entitlement has to be aligned with the organizational key imperatives like Vision, Long-term plan and short-term goals also the key processes that contribute to the business goals need to be considered Assess: For all the key processes a Process Entitlement assessment has to be calculated with the below outcomes · Current Performance Baseline · Peak Performance sustained over some time · Potential Entitlement level Approve: Map the improvement opportunities in line with the organizational key imperatives (Long-term goals, short-term goals, vision). Review the improvement opportunities and define a SMART goal and success criteria for each initiative. A roadmap is defined to implement the improvement initiatives governed and supported by the Six Sigma professionals in the organization Benefits of Entitlement Process Entitlement helps to · Identify the hidden potential within the process without impacting the set-up · Set realistic (SMART) goals for the process · Increase process efficiency, and revenues, optimize cost etc · Estimate a breakthrough level of Improvement within the process

