

Keerthi vasan
Members
-
Joined
-
Last visited
Everything posted by Keerthi vasan
-
Lets take the case of an online vendor exploring ways to improve his service level. Presently, the average duration for is 48 hours and the business looks to enhance customer satisfaction by reducing this delivery time. The vendor invests in new technologies and enhancements in logistics and the updated procedure empowers the business to process and dispatch orders within 24 hours, effectively halving the processing time. As a result of this, the business decides to revise the specification limit aligning them with the recent standard. This is a typical example of how a retailer's aim to improve the service level leads to revision of specification limits.
-
RPN = severity * occurrence * detection Wherein severity 1 - low impact, 10 - high impact Occurrence 1 - rare, 10 - frequent Detection 1 - easy to detect, 10 - tedious to detect A value of 1 is possible when all three parameters are minimal - minimum impact, extremely rare occurrence and highly effective detection system. Examples 1 - running out of stock on office supplies (pen, paper etc.). Since inconvenience is minor, rare case wherein admin is out of stock and easily detectable, RPN for this example is 1. 2 - slot machines underpaying a player (from Casino management perspective). Since financial impact is marginal, Slot machines rarely have technical glitch and Casino's outlier management system are highly effective, this scenario has a RPN value of 1
-
Yes, although it's rare but it is possible for the value to be zero- it means the independent variables don't explain any variability in the dependent variable. Some reasons are below: 1. Selection of incorrect controllable variables 2. Non linearity relationship between variables Examples 1. Selection of incorrect independent variables Modelling company top line as dependent variable and employee birthday as independent variable. Since both the variables are completely unrelated, the results would be skewed. 2. Non linearity Creating a model using delivery time as output variable and inventory level as input variable (this is because of impact of other parameters like traffic, breakdown etc.). This can be solved by using polynomial or non linear regression model.
-
Risk Priority Number (RPN) helps to assess risk in a process. Higher the magnitude of RPN, scarier the risk. RPN = severity * occurence * detection Each factor ranges from 1 to 10 thereby making RPN have 1 as minimum possible value (least risk) and 1000 as maximum possible value (highest risk). RPN of 1000 happens where all the three parameters are at maximum - impact is severe, likelihood of occurence is high and chance of detection is rare - immediate attention is needed for such processes. (For example) Lets take the case of card counting in blackjack game in Casino (from Casino management point of view). Severity = 10 - Casino will lose money since the house edge reduces during card counting Occurence = 10 - high possibility of players to do card counting since it increases the chance of winning Detection = 10 - very difficult for Casino to differentiate card counters from normal players RPN for this example is 1000 making it a high risk process to be worked upon immediately - else it will impact the profitability of the casino.
-
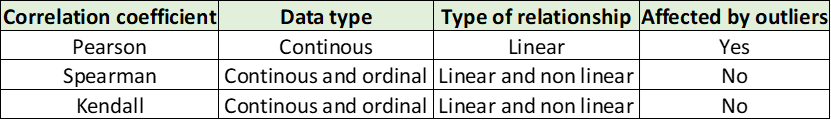
Correlation shows the direction (positive or negative) and strength (strong, weak or null) of relationship between two variables. It is represented using correlation coefficient. Its value lies between -1 to +1; higher the magnitude, stronger the relationship between variables. Types of correlation coefficient are as follows: There can be cases wherein the correlation coefficient is zero for a known cause and effect relationship - this is because of the following reasons: 1. Non linear relationship between variables One assumption while working with Correlation coefficient and regression is that there is a linear relationship between variables. If this assumption is violated, the correlation coefficient values can vary significantly. 2. Interaction effect Interaction between the variables in consideration and other external variables can cause the correlation coefficient to be zero. (Example) In ecommerce, customer satisfaction is poor for slow deliveries. As delivery time improves, the customer satisfaction improves significantly at first. Beyond a certain point any improvement in delivery time will not impact the customer satisfaction - satisfaction will be affected by other variables like quality, customer support, pricing etc. thereby dropping the coefficient value close to zero despite a known cause and effect relationship
-
The concept of control limits in statistical process control says that control limits are not arbitrarily determined but are instead based on data and statistical analysis. These limits are initially set to reflect the process's historical performance, and they represent the typical variation in the process under stable conditions. Control limits can be influenced or adjusted when process improvements or changes occur. This practice ensures that control charts remain relevant and effective in monitoring the process's ongoing performance and aligning with the principles of continuous improvement. Example In a roulette game in Casino, the control limits can be set by management based on roulette wheel design. In case the Casino notices an unusual pattern, they can influence the control limits by recalibration / changing to a new wheel. This proves that control limits are not rigid but can be adjusted to maintain the integrity of the game
-
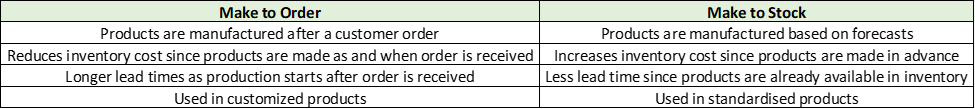
Difference between Make to Order and Make to Stock Which is better? Make to order is better when - Working capital cannot be blocked - Customization is needed - Uncertain demand patterns Make to stock is better when - Economies of scale can be achieved - Stable demand - Shorter lead time is needed Examples Make to Order Wedding costumes are make to order - it is customized based on requirements from bride and groom Aero planes Rolls Royce car Make to Stock iPhone - Apple's iPhone is an example of make to stock. Demand is forecasted based on historic sales of older versions of iPhones / phones with similar configurations FMCG products
-
Attribute Agreement Analysis (AAA) is a statistical method used to assess the level of agreement among different individuals. It is used in cases wherein measurement value has finite number of categories (discrete data). Parameter used to evaluate level of agreement Fleiss Kappa - Used for nominal data - Higher the value of Kappa, stronger the association - Absolute agreement between ratings - Ranges from 0 to 1 (although negative values is also possible) Kendall's coefficient - Used for ordinal data - Higher the value, stronger the association - Association between ratings - Ranges from -1 to +1 Cohen's Kappa - Similar to Fleiss Kappa except that there are only two individuals / evaluators Meaning of caution A caution results when Kappa value is greater than 0.7 but less than 0.9. It indicates a moderate level of inconsistency / disagreement among individuals in evaluation. It suggests there can be some issues with reliability of evaluation process. Steps to improve consistency 1. Source of disagreement Need to understand why there is a moderate level of inconsistency. If all evaluators have moderate scores, there might be a need to change the measurement system. 2. Evaluate training Review the training and instructions provided to evaluators. If only few evaluators have moderate scores, they can be trained. In case of poor between evaluators score, all evaluators can be trained. 3. Addition of more evaluators Try adding more evaluators to improve the reliability. Rerun AAA to check if the change brings in improvement.
-
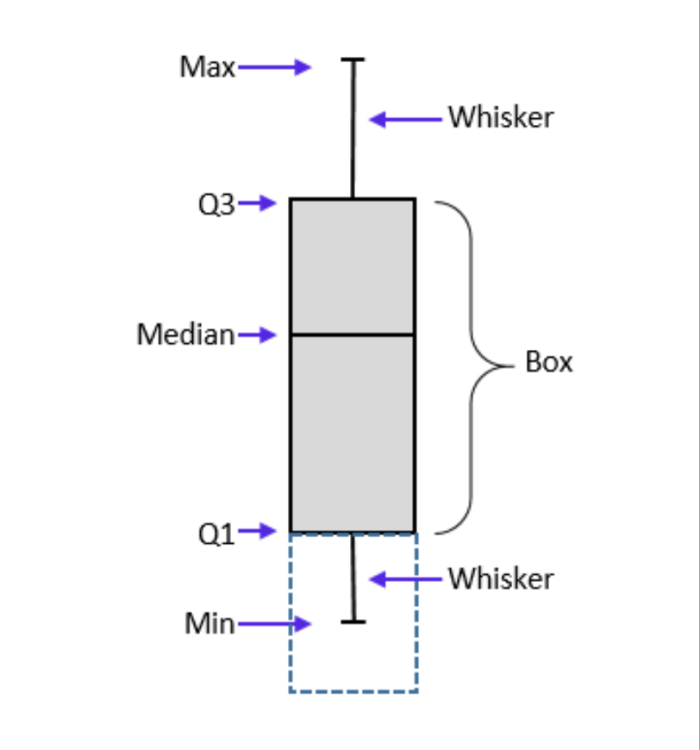
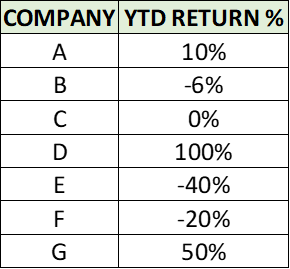
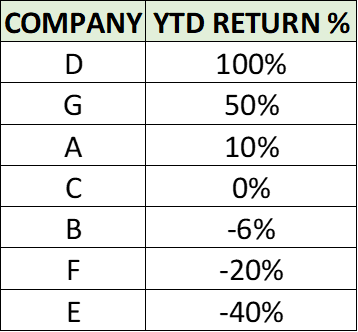
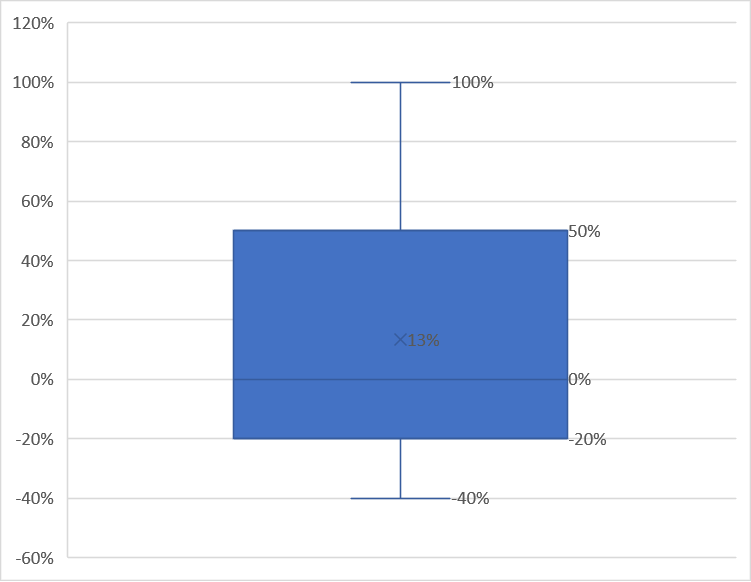
Quartiles are used to categorize data points based on their position on a data set. Data is divided into 4 intervals based on values of data and how they compare to other data points. Each interval represents 25% of data points. It is analogous to median with the difference being median divides the data into 2 halves (50% each) while quartiles divides the data into 4 intervals (25% each). 1. Top quartile Also called as Upper quartile Contains top 25% of data It is 75th percentile of data 2. Middle quartile Also called as second quartile It is the 50th percentile of data It shows the central tendency of data 3. Bottom quartile Also called as lower quartile Contains bottom 25% of data Usage of quartiles: 1. Helps understand distribution of data without being influenced by extreme values (outliers) 2. Helpful in finding outliers 3. Helps to understand central tendency and distribution Quartiles divide the data into 4 intervals: First interval - Contains data points between minimum value and bottom quartile Second interval - Contains data points between bottom quartile and median Third interval - Contains data points between median and top quartile Fourth interval - Contains data points between top quartile and maximum value Box plot best represents the quartiles. A sample box plot is given below How to locate position of quartiles: First operation to be done before using the formula is to rank / sort the data. For odd number of data points: Bottom quartile (Q1) = (N+1) * 1/4 Middle quartile (Q2) = (N+1) * 2/4 Upper quartile (Q3) = (N+1) * 3/4 where N is count of data points. For even number of data points: Bottom quartile (Q1) = median in lower half of data (not including median) Middle quartile (Q2) = average of middle two values Upper quartile (Q3) = median in upper half of data (not including median) Outliers: Interquartile range = Q3 - Q1 Outlier = 1.5 * IQR (any data higher / lower than this value) Example: Person ABCDE wants to invest in stock market. He looks at the annual return % as the only evaluation parameter - data is shown below: First step is to sort the data Box plot is as follows Bottom quartile = (7+1)* 1/4 = 2nd data point from bottom (-20% returns) Middle quartile = (7+1)* 2/4 = 4th data point (0% returns) Top quartile = (7+1)* 3/4 = 2nd data point from top (50% returns) Returns of company D is above top quartile. Hence person ABCDE decides to invest in company D. Also, company E is to be avoided since the returns are below bottom quartile.
-
-
Overall standard deviation is the standard deviation of all measurements and it is an estimate of overall process variation while within standard deviation is an estimate of variation within all sub groups. There can be cases where within standard deviation is higher than overall standard deviation. It indicates greater variation within sub groups and that the process is not stable. It can also mean that our process can have other sources of variations in addition to variation with sub groups.

-
TPM Total Productive Maintenance is a methodology aimed at improving the efficiency and productivity of production processes through elimination of unplanned downtime, defects, accidents etc. TPM is a continuous improvement process which requires involvement of everyone from the team and is executed through implementation of its 8 pillars. The pillars of TPM are as follows: 1. Autonomous maintenance - Operators are trained to perform routine preventive maintenance activities - goal of this pillar is to improve ownership quality among team. Examples include cleaning, inspection, lubrication etc. 2. Planned maintenance - Scheduled maintenance activities are to be done on machines. Goal of this pillar is to avoid unplanned downtime. This follows a pro active approach rather than reactive / post mortem approach. Scheduling is done based on historic data patterns. Planned maintenance can be of two types - preventive maintenance and predictive maintenance. 3. Quality maintenance - This pillars focus is to eliminate quality issues by analyzing the causes of defects. Goal of this pillar is to prevent defective products from being generated. 4. Focused improvement - This pillar focus is to make small improvements by analyzing present process, eliminating waste/ non value added activities etc. Main focus is to do consistent small improvements. 5. Early equipment management - This pillar is about utilizing knowledge of machines to machines design. Goal is to achieve optimal performance from first production day. 6. Training - To execute all the TPM activities, it is vital to train team members on all aspects (problem identification, routine maintenance, team building etc.). Goal is to train all team members on all aspects of TPM. 7. Safety and environment - Goal of this is to provide safe and healthy workplace to all employees. This can be achieved by focusing on eliminating accidents, mishaps etc. 8. Administrative TPM - Although admin is not directly involved in production, TPM methodologies can be used to eliminate waste and improve efficiency in administrative operations. TPM vs TQM 1. TPM is equipment focused while TQM is customer focused (both internal and external). (Eg.) KPI for TQM is customer satisfaction while KPI for TPM is machine uptime. 2. Goal of TQM is to improve quality of products / services while TPM is to improve efficiency of equipment.


