

Ashutosh Bhardwaj
Members
-
Joined
-
Last visited
-
Ashutosh Bhardwaj replied to Vishwadeep Khatri's topic in We ask and you answer! The best answer wins!Process entitlement is a concept to understand the scope of process improvement . Entitlement defined what is the possible to get best performance which we can expect to achieve from process optimization. Let us suppose that entitlement is 1000 mobile assembly per hour in assembly division and baseline performance of production line is 500 mobile assembly per hour. We can say that there is a big gap between baseline performance and entitlement. On the other side, if baseline performance of production line is 950 mobile assembly per hour then can say there is a little scope of improvement. If higher production rate is required, our existing process will not serve the purpose, we have to develop a new process which may require re-engineering process activity. Entitlement can be helpful in DMAIC projects for goal setting, developing internal bench-marking, providing powerful insight to project team leader by determining major key parameters such as cost of poor quality, machine breakdown time, Rolled throughput yield, machine capacity, waste reduction and Name plate capacity projects etc. Method of calculating entitlement and utilization in computing the target calculation: Entitlement is considered as top performance of the process, as we are acquainted about lesser machine breakdown is required for consistent and better productivity so in a manufacturing unit, average machine breakdown is around 785 min per week and minimum breakdown is being achieved upto 640 min per week. In this case, we can say the entitlement 640 min/week. Entitlement and baseline data can be helpful to set the first target value of the project with the help of below equation: Computed Target= Baseline – ( Baseline-Entitlement)*70% We may consider first target of reducing machine breakdown ( average) 684 min/week from baseline 640 min/week. In case of process capability analysis, if process owner finds Cp=Ppk then he should understand that process is operating at its entitlement level of variation. He should keep monitoring the capability of process or can redesign the process to improve its entitlement level of performance. Another example : "Suppose manufacturing unit has operating cost 300 INR per product ( average) but had 200 INR per product for couple of days. This suggest that best operating performance should be 200 INR per product. After delving into further investigation, it observed that a linear relation generated defects and operating cost per product. Y=f(x) defects should be reduced at very low level to achieve process entitlement" How does it help in process improvement? Process entitlement is a concept to understand the current performance of the process. It also very helpful to build up internal benchmark setting for project selection or goal setting. As we know that process entitlement is totally based on practical based data. Process leader can avoid to take idealistic project target such as *Cost of poor quality target “ZERO” *First Pass yield target “ 100%” *Machine breakdown “ ZERO “ Suppose in manufacturing factory, first pass yield is running 90% in long term period but for couple of days first pass yield starts achieving 98% then we need to delve into the causes of such high improvement in the yield. If everything is OK in existing process as per defined specifications/ control plan then it depicts the possibility to achieve yield 98% on existing line. Process Leader is supposed to find out the causes of this improvement like any change in bill of material, environment impact, machine behavior/ breakdown activity and other criteria to find out the actual cause rather than say “luck by chance, first pass yield achieved 98% yield for few days”.

-
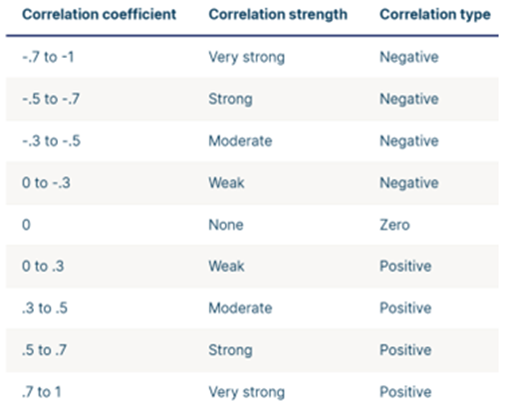
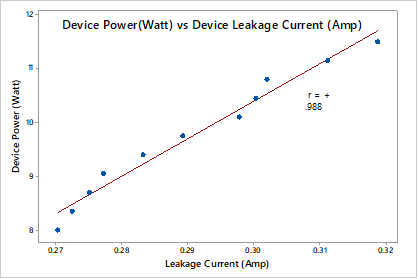
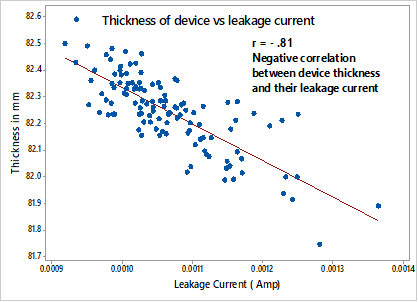
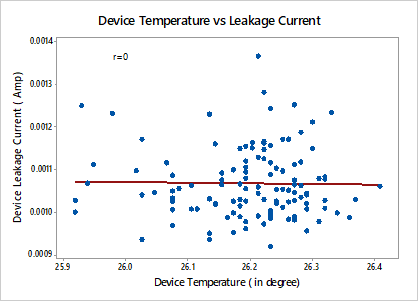
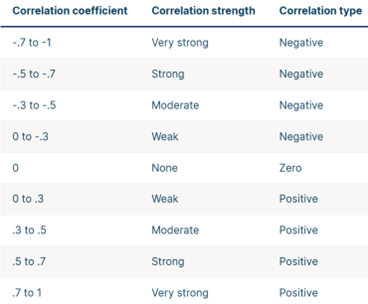
Ashutosh Bhardwaj replied to Vishwadeep Khatri's topic in We ask and you answer! The best answer wins!Coefficient of determination is an indicator which set up a relative relationship between two variables where one variable is called dependent and other independent denoted by “Y” and “X” respectively. Coefficient of determination can be computed with the help of below formula ( symbolized by “r”) There are three type of correlation, as stated below: Positive Correlation : when one variable increases then other will also increase, called positive correlation between two variables. Negative Correlation: When one variable decreases then other will also decrease. Called negative correlation between two variables. No Correlation: when one variable increases or decrease, there is no change in other variable is called no-correlation between two variables. To compute the strength of correlation, we find range from +1 to -1 ( with the help of above formula). If coefficient of determination value is closed to 1 is called strong correlation ( on either positive or negative side), if r-value is zero, it indicates that there is no relation between both variables. We can splinter coefficient of determination range as per below table for more articulation : Example of +ve correlation between Semiconductor device and leakage current: higher the wattage, higher the leakage current. It's shows positive strong relation. Example of -ve relationship, increasing device thickness reduces leakage current. showing -ve correlation. No Correlation for a known cause and effect? No correlation between both variables, device leakage current with device temperature. All shown parameters are important for device reliability but it does not mean that all parameters have direct relation to each other in the reference of above +ve and -ve relationship examples. In case, when gauge happens to be out of order and dependent variable is not being changed by changing independent variable, relation between both variable get lost ( coefficient of determination r=0). while both parameters have strong positive relationship.

-
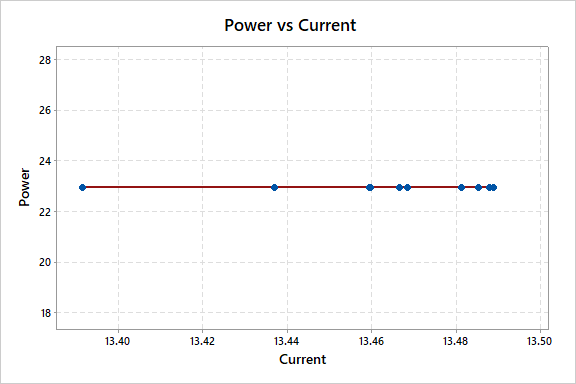
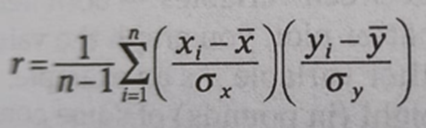
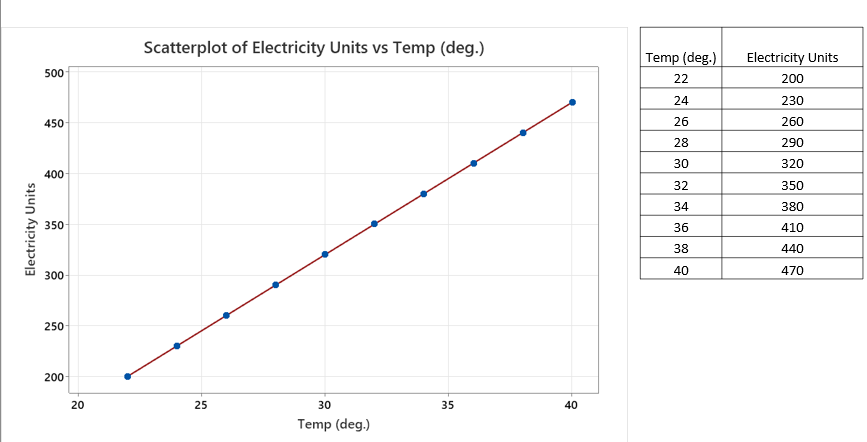
Ashutosh Bhardwaj replied to Vishwadeep Khatri's topic in We ask and you answer! The best answer wins!Correlation coefficient is an indicator which confirms the availability of a linear relationship between two variables (say “X” and “Y” variables). Measured correlation coefficient (signified by "r") falls between -1 to +1 and consider as unit free. Formula : n= number of data pairs xi & yi are average of x & y variables. X-bar and y-bar are average of x and y measurements. σx and σy are standard deviations of x and y respectively. There are three major conditions as stated below- Condition-1: “ if r value is greater than zero” If we find r value greater than zero between x and y variables, it indicates positive correlation between both variables. Positive correlation is nothing but proportional relationship which determines incrementation in x variable will increase Y variable as well. Condition-2: “ if r value is less than zero” There will be inversely proportional relationship between x and y variable if computed r-value is less than zero. Negative relationship takes place when x independent variable increase, the value of dependent variable decreases and vice versa. Condition-3: “ if r value is zero” If coefficient value is close to or equal to zero means, there is no relation between both variables. Magnitude of correlation will depend on how close the r-value towards 1. Below table can help out to understand how strong our calculated correlation is: Perfect correlation either “+1” or “-1” is difficult to find out practically because there are always common cause and environment variation available in system. This ideal condition can be possible in case of changing both variables with constant interval values. Let us understand for perfect positive correlation (r=1): Increment in environment temperature by 2 degree centigrade will increase electricity units (kwh) by 30 . In that case all data points will be on linear line as shown in below graph and coefficient will be “+1”.
-
Ashutosh Bhardwaj replied to Vishwadeep Khatri's topic in We ask and you answer! The best answer wins!Make to Order is one of the business strategy which is based on order confirmed by customer, it signifies unique or specific requirement. It follows Pull-system in the process therefore several advantage are considered like no-inventory risk, efficient use of resources, higher customer satisfaction and minimum wastage Lets us take an example of MTO in computer-business; Dell is one of the world largest tech company who are expert in supplying of Laptop / Desktop with identical technical specifications to fulfill customer requirements. We see most of the manufacturing units, corporate offices and other business places their order to DELL because of their expertise in providing machines with asked technical configuration within stipulated time. MTO approach results high customer satisfaction and business repeatability to DELL. Make to Stock is based on demand forecast strategy. As per production workflow process, MTS belongs to the Push system which waits for the buyer to purchase product. There are some of the potential risk in MTS like inventory issue, product expiry date, seasonality, market demand fluctuation. Once again consider an example of DELL company which produces laptop/Desktop with several configuration while keeping customer requirement & budget in mind ( based on market survey ) and push material stocks to store for sale, this approach is called MTS. Same company follows MTS and MTO strategy for making the origination profitable and sustainable in business. product-examples of MTS & MTO: “FMCG companies' product like Toothpaste, soaps, biscuits are good example of make to stock while Aircrafts, customized cars & machines are for Make to Order” Which of the two approaches is better? In my opinion, Make to order is better than make to stock because MTO works on Pull approach. There is no inventory, minimum waste and efficient utilization of workforce in comparison of MTS. Make to order requires expertise to provide personalized product which gives competitive advantage with good profitable business. Diagram:

-
Ashutosh Bhardwaj replied to Vishwadeep Khatri's topic in We ask and you answer! The best answer wins!Cp/Cpk are used to measure the current performance of the process means short range capability of the process. Cp determines the capability of the process but missing center tendency while Cpk confirms the centering of the process. Higher Cp does not mean that the process is centered therefore we need to check both Cp/Cpk values in collected sample data by using below formula’s: “Cp= specification width / Process width or [ ( USL-LSL) / 6*σ ] σ= standard deviation-short term” “Cpk = (mean- specification) / 3* σ. or (Specification-mean)/3*σ Pp/Ppk are performance indices measured for overall capability of the process. It is computed with long term standard deviation in place of short-term standard deviation in above formula. Broadly, Pp/Ppk refers to historical process performance to acknowledge that whether was in control or not. While doing the DMAIC project, we check all Cp/Cpk & Pp/Ppk for assimilating the present process status and impact of long period of time but most quite useful is Cp/Cpk which estimate the sigma level of process. Below table for reference and relation among process capability and sigma level.

-
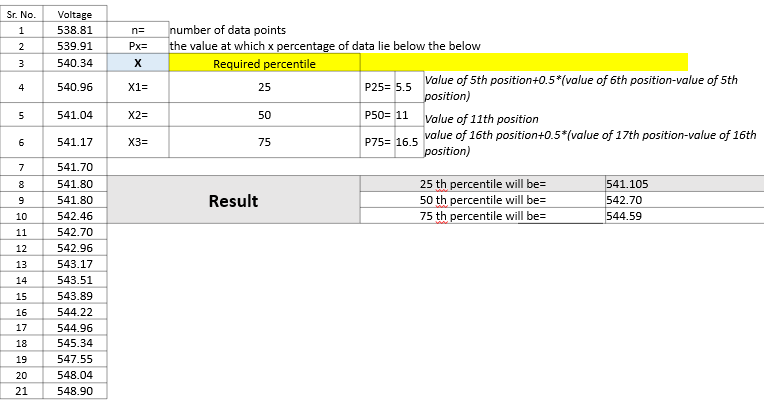
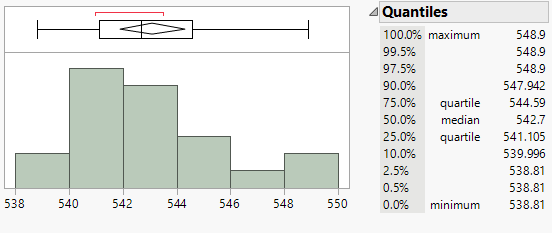
Ashutosh Bhardwaj replied to Vishwadeep Khatri's topic in We ask and you answer! The best answer wins!Before understanding the quartile, let us understand the percentile concept which provides detailed information about how data are spread over the internal from the smallest value to the largest value. it is calculated by Px=x(n+1) /100 ; where Px is the value at which x percentage of data lie below the value and n is the total number of observation. Suppose we have 21 solar modules power data and want to check the 25th, 50th and 75th percentile value from data then here is the answer by using formula: 25th percentile is nothing but Bottom quartile which means 25% data points are below in your rank ordered sequence. 75th percentile indicates to Top quartile which means 75% data points below rank ordered sequence. 50th percentile belongs to Middle quartile which means half of the data lies above and half below. Below graphical summary of the same data represents quartile score as stated above. it is used to determine the data central tendency, skewness etc.
-
Ashutosh Bhardwaj replied to Vishwadeep Khatri's topic in We ask and you answer! The best answer wins!Pooled standard deviation is the weighted average standard deviation for two or more independent groups. Larger samples are given more weight in decision. There are two method of calculating pooled-standard deviation: 1. 2. 2nd method is supportive only when sample size is same for individual groups. lets us understand impact of both methods with the help of examples: Suppose we have four individual groups of solar cell efficiency with same sample sizes ( shown in below table). Pooled standard deviation value will be “ 0.061826” by using first method . If we use second method then pooled standard deviation value will also be “0.061826” . Both methods are showing same pooled standard deviation value because 1st and 2nd methods will perform same in case of same sample sizes. To discern between both methods, let's change sample size of Group-1 from value "6" to "5" and let's check pooled standard deviation for both methods. Now it shows different pooled standard deviation due to sample size non-equal for individual groups. In this case pooled-std deviation value " 0.0634" is acceptable. it indicates that "more weight given to larger samples".


-
Ashutosh Bhardwaj replied to Vishwadeep Khatri's topic in We ask and you answer! The best answer wins!Standard deviation represents the typical (average) distance from the central location we expect to observe. Its units are exactly the same as our original measurement. Smaller the standard deviation, the better it is. Type of standard deviations are: 1. Overall Standard deviation Standard deviation is computed for all data points of long period like entire month. In this case, it represents actual variation of the process that the customer experiences over the time. 2. Within Standard Deviation It is an estimate of variation within the subgroup. This represents inherent variation of the process over a short period of time. This shows potential variation of the process if shifts and drifts between subgroups were eliminated. “Below reference picture will articulate more visualization in terms of short-term samples and long-term samples." Could there be a scenario where within standard deviation is greater than the overall standard deviation? Practically, Overall standard deviation should always be greater than or equal to the calculated within-standard deviation because standard deviation (overall) is affected by various causes for examples like “Equipment breakdown”, “Environment Effect”, “Unskilled operator deployment on machines’, “Difference between raw materials” and other’s special causes in long period of data. On the other side, standard deviation (within) is purely random.it is what we use to compare the inherent capability of different processes to meet a specified goal. Below graphical picture itself portrays the cause of higher overall standard deviation than within standard deviation with time extent.


-
Ashutosh Bhardwaj replied to Vishwadeep Khatri's topic in We ask and you answer! The best answer wins!TPM is an organization-wide effort aimed at reducing loss due to equipment failure, defects, slowing speed. The purpose of TPM is to achieve an economic balance between prevention costs and total cost while reducing failure costs. Below are important pillars of TPM for building a world class organization : Focused Improvement: As name stated, “ Focus improvement” , we improve the effectiveness and efficiency of machines and processes by identifying and eliminating losses and problems. Autonomous maintenance: This pillar involves some activities like cleaning, lubricating the machines/ equipment, inspection and restore the equipment by empowering associates. Planned Maintenance: Regular inspections and machine-part replacement to eliminate or avoid unexpected breakdown.Preventive maintenance is part of it. Quality Management: Attention of this pillar is on preventing defective parts from machine or equipment by identifying root cause analysis, preparing quality checks, Operator training etc. Quality check supports to compare the product before and after the action taken against any breakdown in machine/ equipment. Early equipment management: Under this category, we involve all cross functional departments, stakeholders for the decision or brainstorming about equipment design and its reliability . Education and training: this pillar guide us to involve all equipment operators in developing maintenance skills, it can result in improving the reliability of equipment. Safety, Health and Environment (SHE): In this category, organization target is to build up safe & healthy place for employees and stake holders by working on eliminating hazards and complying with environment regulation. Administration : This pillar extends the TPM principles to administrative, support, and service functions to eliminate waste, improve processes, and enhance efficiency in non-manufacturing areas. How does TPM compare against TQM (Total Quality Management)? An organization can excel growth in good amount if both TPM and TQM concept implementation done accordingly because both concepts propel result towards good quality, performance, productivity and customer orientation. But if we discern both conceptual wise, TQM systematize the management to achieve objectives continuously while TPM increases the equipment efficiency and drive hardware improvement-oriented culture. There are some set of core value / principles of TQM on which organization is to operate like: vCustomer focused vTotal Employee Involvement vProcess-Centered vStrategic and systematic approach vContinual improvement vFact based decision making vCommunications vIntegrated system
-
Ashutosh Bhardwaj replied to Vishwadeep Khatri's topic in We ask and you answer! The best answer wins!As the name suggests, OEE is an overall measure that reflects performance from several aspects, it computes parameter of availability, performance and quality into single key process indicator expressed as a percentage. Out of these parameters, performance rate (%) determines that “does the machine produce level of output that it should do” ? The simplest way of calculating the performance rate is “[Actual output / Predicted output ]% “ Actual output : we consider all parts including good and defective Predicted output : Based upon actual availability and the machine cycle time sometime, performance rate is mis - calculated due to : Scenario-1: Team forgets to consider rejected part into actual output which results wrong performance rate like below example: Data Entry Unit Case-1 Good product: 800 pcs Defective Product: 200 pcs Actual Output ( Good+Defective): 1000 pcs Predicted Output: 1200 pcs Performance Rate ( with defective part): 83.33% % Correct Performance Rate ( without defective part): 66.67% % Wrong Scenerio-2: Some time team adds old stock also in actual output for showing higher throughput which becomes higher than predicted output and result more than 100% performance rate. Case-2 Good product: 800 pcs Defective Product: 200 pcs Actual Output ( Good+Defective): 1000 pcs Old stock for posting: 300 pcs Predicted Output: 1200 pcs Performance Rate ( with defective part): 83.33% % Correct Performance Rate ( with old stock for posting): 108.33% % Wrong Scenerio-3: Actual output can never be more than predicted output otherwise performance shows more than 100% which indicates that cycle time is wrongly set. Case-3 Good product: 1100 pcs Defective Product: 200 pcs Actual Output ( Good+Defective): 1300 pcs Old stock for posting: 300 pcs Predicted Output: 1200 pcs Performance Rate ( with defective part): 108.33% % Wrong In this case need to review ideal cycle time OEM and subject matter expert


