

Ousmane FALL
Members
-
Joined
-
Last visited
-
In Marketing, it is essential to understand the consumer. We can use a tool called the empathy map. An empathy map is a visual tool for understanding and empathizing with consumers. It captures their ideas, feelings, behaviours and requirements. It allows teams to gain deeper insights into customer experiences and perspectives, which can then be used to guide product development, marketing tactics, and customer support activities. As its name suggests, the objective of the empathy map is to put oneself in the place of the Consumer or customer to be studied to better understand the latter. The empathy map is a canvas on which we will represent on a single page what the consumer hears, what he sees, what he says, what he feels and what he does. By looking at things from a consumer's perspective we bring together the information and knowledge available about them to fill out the empathy map. To establish an empathy map, you need to bring together people who are likely to know the Consumer you are targeting well. The empathy map can also be done by a single person, but it is richer if done by a whole team. An empathy map is Consumer-centered and generally consists of below parts. - General information: A description of the target we want to understand, its socio-demographic profile and an overview of its situation. Here you need to draw up a portrait of the person or group of people in the segment you are targeting. - Reflection: in this section, you document what the client thinks or says internally. This may include their goals, motivations, anxieties, desires, and concerns regarding the product or service. What does the customer want to achieve? What does success look like for this customer? and what must the customer do to achieve this? - Perception: What the person hears from others, from colleagues and friends and those around them, but also what the person sees on the market and in their environment. - Says: This quadrant captures what the customer says, such as verbalized statements, quotes, or comments about the product or service. What the person says, how have you heard your consumer or Consumer express themselves? or what can you imagine the customer saying? - Fact: This quadrant focuses on the customer's actions and behaviours. What activities do they carry out regarding the product or service? How do they interact with this? What are their weaknesses or sources of frustration? What the person does and the behaviours you observed in particular. - Feelings: In this quadrant, you will investigate the client's emotions and feelings. What are their emotional reactions or comments about the product or service? Understanding their emotional state can provide valuable information about their desires and priorities. What the person feels and thinks, we can also put here their aspirations and the problems they encounter. This section often contains a subsection called “pains and problems” which represents their frustrations and blockages. Another subsection called “benefits and gains” is where we will put the aspirations and dreams of the Consumer we are targeting. There is a pitfall to avoid when drawing up an empathy map. You must avoid attributing your own feelings to the targeted Consumer when drawing up an empathy map. It is important to put a date and version number on the empathy map because the empathy map will be frequently updated based on additional knowledge that we have about the Consumer of our product and/or services. The advantage of the empathy map is that it is created quickly and provides a very good overview of the profile of our client and/or Consumer. To use an empathy map to determine client requirements during new product development, you should perform the following: 1- Define your targeted consumer segment. 2. Collect customer insights. It is about understanding more about your targeted clients through surveys, interviews, focus groups... Collect as much data as possible for your empathy map. 3- Complete the empathy map using the information you gathered. Use Post-it notes to capture key observations, remarks, behaviours, and emotions from your target clients. 4- Examine the completed empathy map for patterns, themes, and similarities in the customers' thoughts, feelings, behaviours, and wants. Identify challenges that can be addressed through new product development. 5- Use the Empathy Map insights to generate ideas and solutions for innovation or product improvements that better address customers' wishes, preferences, and challenges. Use the Empathy Map as a reference to ensure that your solutions meet the demands of your target audience. This Empathy Map would probably serve the blue ocean strategy. 6- Using the ideas generated, construct prototypes or Minimum Viable Products (MVPs) and obtain consumer feedback via testing and validation. Use this feedback to iterate and improve your product thoughts. Using an empathy map during the new product development process helps organizations obtain a better understanding of their customer's demands, resulting in more customer-centric and successful solutions.
-
Cross docking is order preparation without a storage phase and within a very short time. This method is widely used in certain sectors such as fresh products and IT. It requires very high synchronization of upstream and downstream flows as well as optimal preparation monitoring. To enable cross docking, a logistics platform is needed. A logistics platform is a temporary storage area through which products pass for a few hours, or even a few days, before being shipped to another destination. Its role is mainly to consolidate flows towards a destination to obtain savings in transport. Particularly suitable for cross docking. Cross docking is a logistics strategy that allows smooth coordination between Inbound logistics and outbound logistics. There are several types of cross docking depending on the position in the supply chain. When several packages are received at the platform and are consolidated for grouped transport, we speak of consolidation cross docking. the opposite of consolidation cross docking is called deconsolidation cross docking. When it comes to this type of cross docking, it involves the reception of grouped shipments (large packages) which are subsequently unconsolidated and dispatched into several small packages to several destinations. there are cases where cross docking is a little more complex. we can take the case of distributors. in fact, here, the distributor receives many small packages from several suppliers, with brief storage at the platform and during this short stay a lot of order preparation work is done. thus, dispatching to customers will also be done in several small packages to customers. we are therefore talking about distributors cross docking. we would be tempted to consider industrial cross docking as the fourth type of cross docking, but I think it remains consolidation cross docking. The implementation of cross-docking principles has a huge impact on efficiency and responsiveness within a service-oriented organization. in fact, stock holding costs will be minimized and transport costs will be optimized. In addition to this, cross docking offers visibility over the entire supply chain. However, for effective cross docking, thorough planning is a necessary condition. Cross docking is very often used in the deployment of IT projects. Indeed, to deploy IT projects, in general, there is a service part and equipment, and the latter most often have specific configurations. Therefore, when we deploy several projects at once, a combination of all types of cross docking is sometimes necessary. Several suppliers are involved for the satisfaction of several customers with diverse origins and destinations. this is why we are seeing the erection of several hubs and manufacturers like DELL and CISCO have decided to appoint approved distributors in order to considerably reduce their logistics costs.

-
The monitoring frequency is the time interval between two monitorings. The frequency of monitoring is essential for guaranteeing results. Let's try to see this from a more down-to-earth angle through the example of hospitalized patients. In each hospital, there is a patient monitoring protocol. Indeed, depending on the severity of the illness and the urgency of care, the frequency of monitoring will be more or less frequent. imagine that for patients admitted to intensive care, the monitoring frequency is further away and that for patients awaiting discharge, the monitoring frequency is closer. what is likely to happen? The operations will not be adapted to the needs and the risk of loss of human life will be quite high. Given the previous example, we can say that the business process is comparable to hospital protocol. Therefore, deciding how often to monitor a process with control charts is crucial to the survival of a business. This will help detect and respond effectively to process variations. When determining the frequency of monitoring a process, it is important to consider factors such as the stability of the process, the type and quantity of product data, the costs and resources allocated to monitoring, the sensitivity of the process and the contribution of the process to the overall results of the company. The stability of the process is almost the most determining factor in deciding the monitoring frequency. In fact, the more stable the process is, the less the process will be monitored. and of course, inversely proportionally. If the process is unstable, it will be necessary to systematically monitor it at regular intervals. This will allow variations in performance to be detected early and to more or less have time to correct through controlled actions. On the other hand, if the process is stable, the monitoring frequency will be much less. The pace of data production can also be restrictive for process monitoring. Indeed, for certain cases where data is produced at a slow rate, it is often difficult to closely monitor the processes. If the process generates a large volume of data quickly, more frequent monitoring may be feasible and beneficial. Large-scale manufacturing, with the volume of data generated, must be monitored very closely. If necessary, in the event of a variation in quality, non-conformities will be considerable. The decision to monitor more processes to the detriment of others may lie in the criticality of the latter. If a process has a major contribution to the quality of the product or service, it may justify more frequent monitoring to guarantee performance with very little variation from targets. However, the cost of monitoring may be considerable and requires more resources in terms of time and investment in equipment, software and data storage devices. making it a factor to consider when determining monitoring frequency. Because of the above, it is important to talk about the possible consequences of incorrectly sizing the process monitoring frequency. If the monitoring frequency is too high, it can consume excessive resources. Indeed this will generate waste (MUDA) such as overproduction, overprocessing and an irrational use of resources thus leading to an increase in costs. This frequency, more than necessary, makes it difficult to distinguish between normal variation which does not impact the final quality from those which negatively impact the latter. This leads to excessive adjustments to correct minor variations with unnecessary interventions that can disturb the stability of the process. On the other hand, if the monitoring frequency is too low it can result in delayed detection of variations and deviations in processes, allowing problems to escalate before they are detected and addressed. Therefore, process owners could lose control and this will not militate in favour of the quality of the product or service and will certainly degrade CSAT and NPS. When it comes to continuous improvement, optimization opportunities will be missed. Indeed, certain root causes of problems can remain unsuspected for a fairly long period. In conclusion, to guarantee the stability and control of a process, the frequency of monitoring is important. moreover, since factors such as stability, control, and resources consumed by a process are not static, it is essential to review the monitoring frequencies regularly to maintain a certain alignment between the performance of a process and the monitoring frequency of the latter. Therefore, the frequency of process monitoring can be revised upwards or downwards depending on the results obtained. This will continually improve the said process and overall business results.
-
ACPT analysis is a tool used in contact centers for Root Cause Analysis (RCA). ACPT stands for Affected Call Percentage and Time. As tools like the Ishikawa Diagram use why-why analysis to identify causes and root causes, ACPT will help prioritize the latter. ACPT points out the most significant factors, in terms of contribution, related to a situation. ABC and Pareto are other names of ACPT. ACPT needs to be well structured. The first step is data collection. Indeed, this early step is decisive as it guarantees the analysis quality. At this stage, it will be necessary to gather sufficient data on the operational factors of the contact center. When it comes to a contact center, by operational factors, it is necessary to understand indicators such as the number of calls, the duration of calls, the age of the callers, the geographical area of the callers, the categories of problems reported, the commercial performance of agents, problem resolution times, etc. Once the data is collected, the percentages of units (calls) affected by each identified factor and the time spent treating problems for each previously identified factor are determined. After this representativeness calculation, an analysis of the data will be carried out. There, it will be a question of seeing the weight of each factor on the situation as an effect. For example, we will look for the factors that most often contribute to a high percentage of affected calls and which consume a lot of time. This data analysis involves implementing the Pareto principle (the 80/20 rule, which holds that roughly 80% of the effects come from 20% of the causes. In the context of ACPT analysis, this means focusing efforts on the 20% of factors which are the source of 80% of the problems. These 20% of factors deserve to be analyzed in more depth and it is in this context that we will call on the Gemba and Genchi Gembutsu. Search for real facts (Genchi), Go (and see (Gench Gembutsu) and think. At the end of this in-depth analysis, a corrective action plan must be put in place with clear objectives, responsible people and reasonable deadlines. which triggers the quality wheel (PDCA) because it is necessary to execute the action plan, record the results and conclude with a new action plan. Thus, it is not excluded to review processes, revise skills, organize training, and use digitalization and Strategic Robotics Process Automation to mitigate or even eliminate the impacts and/or occurrence of these 20 % factors which represent 80% of abnormalities. In addition, we can thus confirm that the ACPT fits well into the continuous improvement dynamic. ACPT can be used to level up customer satisfaction, but also to make strategic decisions regarding sales and innovation. With a slight adaptation of the factors, ACPT could be used in all the sectors, data collection permitting.
-
In an organization context, the Objectives and Key Results (OKR) framework is a goal-setting technique that helps set and trail objectives and their related expected outcomes. Here we are talking about primary objectives that the company wants to achieve. These said goals are SMART. By SMART we mean: S: Specific M: Measurable A: Achievable R: Realistic T: Time-bound These objectives are in line with the company's vision and overall strategy. They provide information on expected achievements. These major expected results indicate progress toward achieving the objectives. They are quantifiable and tell us how far or close we are to the goals. These results confirm or refute the effectiveness of the actions taken to achieve the objectives. One of the condition for the OKR framework to work is the establishment of periodic reviews not exceeding every six months. in fact, in general, the objectives are annual and by carrying out quarterly or half-yearly reviews, the company will have more or less time to correct or even change its operational strategies and tactics. In addition to scheduled reviews, there may be occasional reviews at the request of top management. To enable these spot reviews, dashboards with real-time analytics are needed. The Objectives and Key Results framework is a good example of the implementation of the PDCA (Plan Do Check Act) quality wheel. When it comes to goal setting, the OKR framework and Hoshin Kanri satisfy the same needs but with different approaches. Below you will find a comparison table contrasting the two approaches. OKR Framework Hoshin Kanri Generality Focus on results as indicators on the achievements Strategic focus on policies and strategies deployment Timeline Year Multi-year horizon Force Flexibility Long-term planning Approach Bottom-up Top-down The flexibility of the OKR framework pushes many small and medium-sized businesses to adopt it. This type of company needs to control the results about the objectives previously set. On the other hand, for hyper-structured companies that already have a certain control over their results, the Hoshin Kanri approach would be more appropriate. The Hoshin Kanri Matrix or X matrix clearly shows the the links and correlation between Strategic goals, Annual objectives, Top-level and improvement priorities and Key performance indicators. At the same time, the X matrics makes sure that someone is taking an action. However, nothing would prevent both approaches from being carried out at the same time if adapted to the need.
-
Modelling and simulation are very correlated and are often used interchangeably, both are decision-making tools but at the same time, they are different concepts as far as continuous improvement and analysis are concerned. If ever Modelling and Simulation were data, and we run the correlation analysis results would probably be in the area of strong positive or negative correlation. Modeling is all about creating a framework that uses realistic features of a process and or a system under study to obtain pieces of information on the behavior of the said process or system. While building a model both discrete and continuous data can be used. Modelling is statistics only. To perform simulation, we always need a model behind. The model is run over times and all the combinations possible, behavior, and even outputs will be available as a result. We are talking about predicted outcomes, experiments, and hypotheses. While modeling is typically statistics, simulation uses algorithms to calculate and give predictions or prescription. Modeling and simulation can be used either in manufacturing or in services. A business model can be built and simulated on machine production speed and a simulation run basic the said model to find the most effective speed without machine breakdown while satisfying sales needed levels. Modeling and simulation can also be used in the service sector percentage in margin linked to service quality delivered, just to fix the appropriate service level.
-
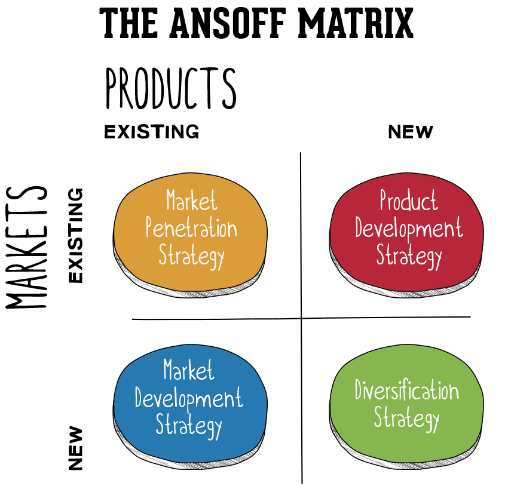
Blue Ocean Strategy is very important in nowadays business market. Today, competition is very rude in existing Markets. Ansof Matrix explains some strategies that will help us understand the blue ocean one. As far as the Ansof matrix is concerned, an Existing product in a new market and a new product in a new market could be considered a Blue Ocean strategy. In a nutshell, when we talk about the blue ocean, we think about higher growth and gross profit increase by creating brand-new demand instead of struggling in a saturated market. This strategy is about supply and demand. For blue ocean creation, the company needs to have a clear and strong vision in addition to an orientation towards innovation and creativity. Six Sigma's main target is to increase quality by reducing defects, and errors and eliminating variation in production in both goods and services. So we can easily say that the blue ocean strategy and Six Sigma objectives are common. Both of them have as primary objectives, the increase in profit for a company. The creation of blue oceans will increase profit by increasing sales via new markets. whereas Six Sigma will increase profit by reducing waste (Muda), creating savings, and increasing product and service quality. The difference between the blue ocean strategy and Six sigma is that Blue Ocean acts upon new markets giving the chance to be the only supplier in that market; and Six Sigma acts on both existing and new markets guaranteeing competitive advantage through product quality and waste elimination.
-
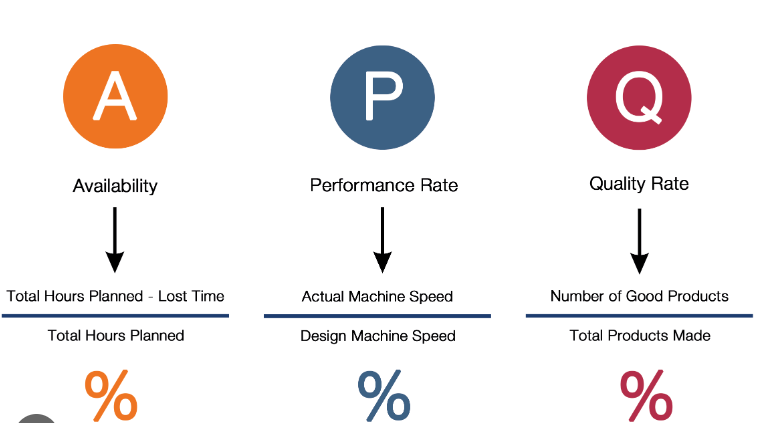
OEE stands for Overall Equipment Effectiveness and is a metric allowing measure equipment performance. It contributes monitoring production productivity. To calculate OEE, we need three factors: - Availability - Performance - Quality OEE will be in percentage, 100% being the best result ever. in fact OEE equals Availability multiply by Performance Multiply by Quality. OEE = A x P x Q For Availability, it is important to understand that stoppage during planned production time are considered. Performance is about Equipment speed. Quality is about defects. if OEE numbers are artificially inflated, the results would not give the right picture and then no corrective action would be driven if ever needed. the best way to have trusted numbers is to consider the data collection as serious activity by either puting in place a manual log book at each Equipment or to digitalize the stoppage recording when availability is concerned. If the short stoppages are not recorded, it is not possible to have good data quality.
-
Process Decision Program Chart is a sort of Risk register. But this risk identification et mitigation tool is connected to a Continuous Improvement projet implementation plan. This is about drawing a plan to ameliorate a process or product and right after that, identify all the risks that could compromise the effectiveness of the solution planned to improve the situation. As far as the risks are concerned, they can either be accepted or Transffered or mitigated. In the PDPC, the mitigation position is to be adopted In contingency planning in process improvement prject, PDPC is used to maximize success rate chance et acheive project expected goals. If we stick to the same process improvement project, we have an important risk that is failure in change management, that is to say, at the end the change didn't get through. Using PDPC, will first of all identify this risk, then the recommandation to use Kotter 8 Steps would be recommanded and implemented to get all the stackeholders get engaged and involved. Below is an example of PDPC

