

Sanuja Godaarawa
Members
-
Joined
-
Last visited
Everything posted by Sanuja Godaarawa
-
Sanuja Godaarawa replied to Vishwadeep Khatri's topic in We ask and you answer! The best answer wins!Decision Intelligence (DI) is a field that combines analytics artificial, intelligence and automation to improve decision making across organization. This aims to take decision process more effective by providing data integrity, AI & machine learning models, focusing human understanding, optimization to the cause of action. This is used in many industries such as manufacturing, public sector, retail and etc. Descriptive analytics focus on what has happened in the past. • We can find the trend such as peak months of the last years. Eg: November and December sales were x% higher than in other months. This helps to identify the higher sales in the w inter months due to the holiday season but it doesn’t predict what will happen next. Diagnostic analytics focus on past data and helps to understand why something happens. • Company can go deeper into why those trends occurred. Eg: there was a sales peak in last year December due to increase of marketing campaigns and promotions. This helps the company to understand the reasons behind the successful sales but it doesn’t give insight about the future. Predictive analytics forecast future outcomes by using historical data. · Company can forecast what will happen in upcoming months Eg: Based on the historical trends the company predict that the sales will increase by X% in December this year For the decision intelligence this will provide the deeper insight since it helps company to forecast future outcomes and plan accordingly. Prescriptive analytics providing the recommendations based on the predictive data. · Company can decide the best action for future. Eg: To achieve predicted X% of sales increase we recommend ramping up inventory for the most popular items start campaign in end of October increase staff at stoles and etc. This doesn’t predict what will happen but provide the best recommendations based on the prediction. When comparing the above types of analytics 'predictive analytics' contributes the most to the decision intelligence since it provides what will happen in future (eg: it will provide the forecast of future sales). Therefore, this helps the company to data driven decisions such as budgeting planning and etc.
-
Sanuja Godaarawa replied to Vishwadeep Khatri's topic in We ask and you answer! The best answer wins!LLM stands for large language model and they are advanced artificial intelligence (AI) systems that designed to generate and understand human language. They are able to do a wide range of activities, including composing essays, summarizing material, translating languages, and responding to inquiries and etc since they have been trained on vast amount of text data. Even though LLMs can perform wider range of tasks below are some problems that LLM cannot solve 01. When the specific task required deep common-sense knowledge or the knowledge of normal events that people take for granted. Eg: Question – If I move a book from the left side of the table to right side where will the book be after I remove my hand? LLM response – The book will stay on the left side of the table In this example LLM is failed to answer because it doesn’t experience the action itself and it is rely on the patterns seen in the data they have been trained and lack direct interaction with the physical world. 02. When the problems require multi-step logical reasoning or advanced mathematical proofs. Eg: The classic two doors puzzle – You are in a room with two doors. One door leads freedom and other lead to death. There are two guards one always tells truth and other always lies. You don’t know which guard is which but you are allow to ask one question each. What questions do you ask to determine the door that leads freedom? Logical solution – You should ask either guard “If I were to ask the other guard which door leads the freedom which door would they point to? · The guard who always tell truth will truthfully tell you that the other guard (liar) would point to the wrong door. · The liar will lie about what the other guard would say and also point to the wrong door. Both cases you will be direct to the wrong door so you simply choose the opposite door. LLM response – you should ask one of the guards which door leads to freedom. In this example LLM fails to address the complexity of the situation because it requires two layers of reasoning that the model should handle simultaneously. 03. LLMs are struggling to conduct real time decision making such as stock market trading or financial decision since it is required consider many factors such as immediate market sentiment/ short term vs long term impact/ risk management/ patterns and trends etc Eg : If I ask what should I do with stock ABC right now? The price has dropped X% after an executive resignation. LLM response – You should consider buying if you think the drop is temporary or selling of you believe the resignation will cause long term harm to the company
-
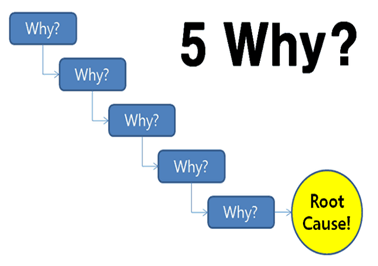
Sanuja Godaarawa replied to Vishwadeep Khatri's topic in We ask and you answer! The best answer wins!5 Why analysis is a problem-solving technique which used to find the root cause by repeatedly asking the question “why”. Even though it is a powerful and widely used tool for root cause analysis, it is not suitable for every situation and there are better alternatives such as fishbone diagram, FMEA (Failure Mode and Effect Analysis), Tree diagram, C&E matrix (Cause and Effect Matrix), pareto analysis and etc that can be used depending on the complexity of the problem, the level of details needed, the type of industry and the issue at hand. Some situations where 5Why is advisable are as follows, 1. When the problem is simple and clear It is effective when the problem's root cause can be directly identified and followed through a clear sequence of events. Eg: A production line stops because a machine isn't operating. 2. When the problem is not complex If the problem is known and causes are easily identifiable then the 5why analysis can be used effectively Eg: An employee misses deadline to finish a report. A brief investigation could indicate that they were not given clear instructions or were distracted with other tasks. 3. Recurrent and repetitive issues When the same issue happens repeatedly then the 5why analysis can be used effectively to eliminate the issue. Eg: Customer consistently complain about slow service. Asking why it can be revealed that the cause is understaffing and can be addressed by hiring more employees. 4. When time or resources are limited When time or resources are limited, and you need a fast, accessible way to investigate an issue, the 5 Whys can offer insights without requiring extensive data collection or analysis. Eg: In a fast-paced workplace, a team leader might use 5 Whys to quickly understand why a task was delayed and address it immediately. Some situations where 5why is not advisable 1. Complex problems When the problem is complex and has multiple independent causes 5why cannot be used effectively. Eg: A factory is experiencing high defect rates in its products, which could be due to a combination of poor machine calibration, inadequate training, improper materials, and a lack of quality control checks. In such cases, the 5 Whys may miss some of the contributing factors, and a more thorough analysis like a Fishbone Diagram or FMEA would be more appropriate. 2. Lack of experience and knowledge of the team If the team does not have sufficient experience or understanding of the process or system, they might inadvertently stop at the wrong cause or overlook important factors. Eg: In an IT company, a system crashes repeatedly, and a team without enough technical knowledge might assume it’s a hardware failure when the root cause is actually a software bug. In this case, more technical tools (like Log Analysis or Root Cause Tree Analysis) would be necessary to get to the correct conclusion. 3. When the problem is highly subjective If the problem is subjective or related to human perception, emotions, or behavior, the answers may be biased, and it may be difficult to find the root cause using this method. Eg: In a customer service scenario, a customer reports dissatisfaction with a product, but the exact reason for their dissatisfaction is unclear. If the issue is related to subjective factors like expectations or personal preferences, 5 Whys might not be able to uncover the true cause, and other methods like customer feedback analysis or surveys might be more effective. 4. When it is required to quantify the cause 5whys works best with the qualitative data but for problems that require precise measurements or statistical evidence to identify trends and causes, it might need tools like Pareto Analysis, SPC (Statistical Process Control), or Regression Analysis. Eg: A manufacturing process is showing variation in product dimensions, and you need to quantify the degree of variation. In such a case, statistical analysis (like Control Charts or Histograms) would be a more effective approach than 5 Whys.
-
Sanuja Godaarawa replied to Vishwadeep Khatri's topic in We ask and you answer! The best answer wins!Yield Management is a variable pricing strategy that is used to optimize the profit. This is a marketing strategy to sell the same products to consumers at different prices based on market factors such as demand or competition. This is mainly used in industries such as airlines, hotels, car rentals, and entertainment. Airline: Airlines use yield management by constantly modifying rates according to demand, booking time, and ticket availability. Hotels: Hotels use it to manage room pricing based on factors like seasonality, holidays, and local events. Car Rentals: It uses yield management to optimize fleet usage by adjusting pricing based on rental length, location, and local demand patterns. Entertainments: Parks have implemented yield management strategies by using differentiated ticket prices based on peak and non-peak days. Yield management is not always applicable for all industries and below conditions required for its successful implementation, Fluctuating demand The demand must be fluctuating and predictable. If the organization can predict the periods of high and low demands based on external factors such as seasonality, day of the week, time of the day, etc then the prices can be adjusted based on that. Eg: Airlines experience high demand on holidays and weekends and they adjust the prices based on this. Perishable inventory The product or service should have a limited shelf life. If the product/service is not sold within a specific period then it loses its value. Eg: An empty seat on a flight cannot generate revenue after the plane has taken off. To mitigate this, they are adjusting the prices by offering special discounts for early booking, and last-minute deals. Fixed or limited capacity A product or service should have a fixed amount of resources or inventory. If the amount of the resources or inventory cannot be expanded to meet the increasing demand then the goal is to maximize the revenue from the limited resources by adjusting the prices. Eg: An airline cannot add more seats to a flight once the plane is in service, so it uses yield management to sell seats at varying prices based on booking time and demand. High fixed cost and low marginal cost Product/service should have high fixed costs (infrastructure, equipment, etc) and low marginal cost for additional units. Once the fixed cost is covered the additional sales significantly contribute to the profit hence the price can be adjusted to attract more customers. Eg: The airline industry has a high fixed cost and includes the costs such as aircraft purchasing, cost of crew, maintenance, insurance, etc. The marginal costs are relatively low once a flight is scheduled and include fuel, food and beverage, baggage handling, airport, and security fees. Therefore, an airline might sell some seats at a lower fare to fill the flight and increase prices as the departure date nears to capture higher-paying customers to make higher revenue. Limitations of applying this strategy universally This is not applicable to every industry This strategy is mainly applicable for the industry that has fixed resources and perishable inventory. The industry where the product can be produced or stored on demand can use this strategy but it is less effective. Depend on the customer behaviors of the industries Customers are expecting stable prices in some industries such as grocery, pharmaceutical, healthcare, utilities, education, etc. Therefore, applying this strategy in these kinds of industries will lead to customer dissatisfaction. Leads ethical dilemma This could take place when applying this strategy, especially in essential services. Prioritizing higher-paying customers could be seen as unfair. Required higher investments To implement the strategy successfully, it is required the relevant infrastructure and trained personnel. Highly depend on external factors External factors such as natural disasters, pandemics, and economic downturns can disrupt demand patterns. Due to this, the previous pricing models can be ineffective.
-
Sanuja Godaarawa replied to Vishwadeep Khatri's topic in We ask and you answer! The best answer wins!Standard work is a Lean Management concept which has the detailed representation and documentation of the most efficient way to complete a particular task or process. It Includes set of steps to follow for specific tasks which aim to reduce variability, enhance consistency, and promote continuous improvement in the workplace. Work Instruction is a written document which includes precise and clear steps to carry out a single instruction. It is typically used to ensure consistency, quality, and safety in operations. Standard Work Work Instruction Purpose Reduce variability, improve efficiency, and maintain quality standards Provide a detailed reference, ensuring employees perform tasks accurately and safely, especially for complex or specialized tasks Scope Covers the entire workflow or process sequence Covers one particular activity Information Eg: Takt time, Work sequence, standard inventory levels Eg: Exact measurements, tools needed, quality checks Usage Supervisory or management level to monitor process performance and ensure adherence to best practices Front-line workers or operators to perform individual tasks Visual representation High-level visual maps, job elements sheets Step-by-step instructions, images, diagrams, and checklists The relative importance of Standard Work and Work Instructions varies based on the operational objectives and application situation because each serves a unique purpose and complements the other in driving operational efficiency and consistency. When these tools work together, it build a strong system that improves task accuracy and process efficiency. Eg: Organization can use Standard Work to establish a baseline for process consistency and efficiency and Work Instructions to guide detailed task execution and ensure compliance.
-
Sanuja Godaarawa replied to Vishwadeep Khatri's topic in We ask and you answer! The best answer wins!Lean six sigma is a process improvement methodology which used to improve the performance by systematically removing operational waste and reducing process variation. It combines Six Sigma methods and tools with the Lean manufacturing. ISO 9001 is a quality management system which helps organizations to ensure that they meet customer and other stakeholder needs within the statutory and regulatory requirements related to a product or service. Both ISO 9001 and Six Sigma use a process approach in applying their methodologies and below are some main differences of ISO 9001 and Lean Six Sigma, ISO 9001 Lean Six Sigma Focus Focuses on Establish Quality Management System Focuses on process improvement and waste reduction Approach ISO 9001 is more prescriptive and process-oriented Lean Six Sigma is more flexible and data-driven. Scope Scope is broad. Focusing overall quality management system of an organization Scope is Narrow. Targeting specific processes for improvement Outcome Primarily enhances customer satisfaction and compliance Directly impacts operational efficiency, defect rates, and cost savings Even though ISO 9001 and Lean Six Sigma are have some similar advantages and disadvantages, the way it creates differ from each other, Advantages: ISO 9001 Lean Six Sigma Customer satisfaction Enhances through consistent quality Directly improves through defect reduction Efficiency Standardizes processes for consistency Streamlines processes for efficiency Documentation Emphasizes thorough documentation Relies on data analysis, less on documentation Continuous Improvement Regular audits and reviews Ongoing projects and initiatives Employee Engagement Involves employees in quality processes Engages employees in problem-solving Risk Management Focus on compliance and risk assessment Reduces variability and defects Market Credibility Certification enhances reputation Demonstrated efficiency boosts credibility Disadvantages: ISO 9001 Lean Six Sigma Complexity Lead to bureaucratic processes Requires significant cultural change Cost Certification and maintenance can be expensive Initial training costs can be high Resource and Investments Demand resources Implementation can require substantial investment Flexibility Limited adaptability to market changes Overemphasis on data can overshadow qualitative insights Training Requirements Ongoing training needed for compliance Extensive training can be time-consuming There are many situations that the organization can implement both ISO 9001 and Lean Six Sigma. Comprehensive Quality Management System Continuous improvement is one of the key points of ISO 9001 Quality Management System requirements. By implementing specific improvement projects will help to achieve the comprehensive quality management system within the organization. Eg: Boeing, a well-known aerospace manufacturer, established a uniform quality management system throughout its business using ISO 9001. This framework helps the business satisfy particular quality standards, guarantee regulatory compliance, and maintain consistency in its processes—all of which improve customer satisfaction. In parallel, Boeing uses Lean Six Sigma techniques to pinpoint areas where its assembly and production processes need to be improved. To reduce waste, reduce cycle times, and boost production line efficiency, they have undertaken a number of Lean Six Sigma projects. Because of this integration, the company is able to actively pursue continuous improvement while standardizing procedures, which eventually results in higher-quality products and happier customers. Performance Measurement and Improvements Organizations aiming to enhance their performance measurement could apply ISO 9001 to set up a systematic approach to quality management, while Lean Six Sigma can provide the tools for data analysis and process improvement. Eg: Pistone automotive, a supplier of parts to leading automakers. They have used the lean six sigma tools to achieve 100% reduction in defects and ISO 9001's focus on standardization and documentation and this achieved substantial improvements in product quality and customer satisfaction New Product or Service Launch ISO 9001 provides a framework to establish and document quality standards, procedures, and policies while Lean Six Sigma helps in optimizing product development, reducing defects, and ensuring that production processes are efficient. Eg: General Electric Healthcare (GE Healthcare) is a leading provider of medical equipment and digital solutions. GE Healthcare decided to launch a new line of portable ultrasound devices, targeting both developed and emerging markets. The goal was to reduce time-to-market, ensure high-quality standards, and meet diverse regulatory requirements across different regions.GE used six sigma ns lean tools (value stream mapping, waste reduction, DOE) for new product development and ISO 9001 to aligned all new product development processes with its existing ISO 9001 Quality Management System to ensure that each stage adhered to quality standards.
-
Sanuja Godaarawa replied to Vishwadeep Khatri's topic in We ask and you answer! The best answer wins!Theory Of Constraint (TOC) is the methodology of identifying a most important limiting factor which has the highest impact on achieving the goal and then systematically improve the identified limiting factor until it is no longer a constraint. This is achieved through five focusing steps, Lean is the methodology that optimize the organization’s people, resources, effort and energy to create value for the customer. The Five Steps of Lean Thinking, 01) Specify Value from the Perspective of the Customer 02) Identify the Value Streams 03) Flow 04) Pull 05) Perfection Even though both are systematic approaches for the improvements, there are below differences, TOC Lean · Focuses on continuously improving the throughput to make money · Goal is to make profit through improving the throughput · TOC is a production lead approach Eg: This increases the through put with the assumption of sales can just sell more · Assume top-down authorization approach · Even though TOC suggest to reduce setup times, increase reliability, and decrease downtime, it offers no recommendations for how to go about doing this. · TOC measures Throughput, Inventory and Operating Expenses · Focuses on matching throughput to takt time by eliminating wastes · Goal is to make profit through adding value to the customer · Lean is customer lead approach Eg: If the customer demand increases then the process will reset to meet the new takt time for the demand · Considers that everyone in a company can contribute to problem-solving and improvements · Lean provides the techniques such as Single Minute Exchange of die to reduce setup time, total productive maintenance to reduce downtime and etc · Lean measures Lead time, Cost and Value-added percentage

-
Sanuja Godaarawa replied to Vishwadeep Khatri's topic in We ask and you answer! The best answer wins!Manufacturing process stability is necessary for Cp and CpK but it is not necessary for Pp and PpK. PpK and Pp represent the actual performance of the process against the theoretical best and Cp, CpK represent the process’s actual best performance when it is stable. While doing a DMIAC project, it should be used Capability indices. When it comes to DMAIC projects we are mainly focusing on the standard deviation and Cp, CpK also use an estimate for the standard deviation. It clearly measures the ability of the process to meet the specifications while performance indices measures how the actual process performed.
-
Sanuja Godaarawa replied to Vishwadeep Khatri's topic in We ask and you answer! The best answer wins!Product quantity process routing matrix is a technical approach use to group the similar products or services based on the similar steps or processes or equipment it took to create them. When the organization have product or service mix it is difficult to take the decision than having only one product or service since there may be so many differences in each type. Therefore, identifying similar groups will easier the organization to take the suitable decisions. When evaluating Product Quantity Process Routing Matrix, it clearly shows which processes are the most frequently used processes in the operations. This will give a clear insight of where the improvements can have the biggest impact. Organization can prioritize these most frequently used processes for the improvements to increase the efficiency of the organization to give a direct positive impact to their customers. As an example, in a warehouse the inventory management process is a one of frequently used processes and it is a key to the business. By improving this process and achieving 100% stock accuracy will give a 100% customer satisfaction on the stock accuracy and will help to sustain the existing businesses and win more businesses. Product Quantity Process Routing Matrix helps to identify the important processes but some are not being used up to maximum. By reprioritizing this type of processes and improving them will help the organization to increase the efficiency. As an example, an organization have an amazing WMS system but not enough staff to use the system properly. By reprioritizing this, it will help to make the WMS even more useful tool for the organization to increase the efficiency of the organization. This matrix is a great way to find the improvements areas and it will lead the organization to think about more automations to smoothen the flow and it helps to identify the most effective processes and the processes which are not functioning effectively. This will help organization to allocate the resources and remove the inefficiencies of the processes and will help to shorten the product development time frames.
-
Sanuja Godaarawa replied to Vishwadeep Khatri's topic in We ask and you answer! The best answer wins!1-sample Sign test and the 1-sample Wilcoxon test both are non-parametric test. This is used to compare the median of the sample to determine whether there is statistically difference with a standard value. 1-sample Sign test 1-sample Wilcoxon test Assumptions Applicable when data are Non – Normal Applicable when data are Non – Normal The variable data are continuous. The variable data are continuous. Data distribution is non-symmetric and can be left skewed or right skewed. Data distribution is symmetric. Observations are independent. Observations are independent. Sample Size More powerful with large sample size since the statistic is followed the binomial distribution and can be used for small sample size. More powerful with large sample size Power Low powerful than 1-sample Wilcoxon test More powerful than 1-sample sign test since it considers the magnitude of differences. Outliers Not sensitive to outliers More robust against outliers Limitation Required paired data for the calculations but always it may not available. Data taken from random samples from the population hence the correct sample may not capture. Less powerful and it may not detect the difference between paired data. Eg: Manager of the ABC insurance company shows that the median of new life insurance customers per day is 50. The agent of the same insurance company claim that it is more than 50. To analyze whether this is true or wrong we can use 1-Sample sign test and the hypothesis is as follows. Ho: median of new life insurance customers per day = 50 Ha: median of new life insurance customers per day > 50 In a term text of grade 10, it is required to check the median marks for the mathematics is greater than 70%. Then we can apply 1-samaple Wilcoxon test by selecting few marks randomly, Ho: The population Median value = 70% Ha: The population Median value >70%