

Suresh Kumar Gupta
Members
-
Joined
-
Last visited
Everything posted by Suresh Kumar Gupta
-
Suresh Kumar Gupta replied to Vishwadeep Khatri's topic in We ask and you answer! The best answer wins!To decide which control chart should be used to check the consistency of water level in the bottles, we need to consider the type of data and the sample size. Since the QC team picks only one bottle every hour, the sample size is one. This means that the individual measurement chart (I-MR chart) should be used for monitoring the water level. The I-MR chart consists of two charts - the individual chart (I-chart) and the moving range chart (MR-chart). The I-chart is used to monitor the mean of the process, and the MR-chart is used to monitor the variability of the process. Here is an illustration of an I-MR chart: The I-chart shows the individual measurements of water level in each bottle, and the centerline represents the average water level. The upper and lower control limits (UCL and LCL) are calculated based on the average range of the data. The MR-chart shows the moving range between consecutive measurements, and the centerline represents the average range. The UCL and LCL are calculated based on the control limits of the MR-chart. If the data points fall within the control limits, the process is considered stable and under control. If there are any data points outside the control limits or any non-random patterns in the data, it indicates that the process is unstable and needs further investigation. Therefore, by using the I-MR chart, the QC team can monitor the consistency of the water level in each bottle and take corrective actions if necessary to maintain process stability.

-
Suresh Kumar Gupta replied to Vishwadeep Khatri's topic in We ask and you answer! The best answer wins!An Out of Control Action Plan (OCAP) is a structured problem-solving approach that organizations use to address issues that are outside the normal process control limits. It is an essential tool for continuous improvement in organizations as it provides a systematic approach to identify, contain, and eliminate the root cause of problems. OCAPs are typically used in manufacturing and service industries, where quality control is critical to the success of the organization. It involves a team-based approach, where a cross-functional team is assembled to investigate the problem, identify the root cause, and implement corrective actions to prevent the problem from recurring. The OCAP process involves the following steps: Define the problem: The first step is to clearly define the problem and establish the impact it has on the process or product. Contain the problem: The team takes immediate action to prevent the problem from getting worse and impacting other parts of the process or product. Identify the root cause: The team uses problem-solving tools such as fishbone diagrams, flowcharts, and statistical analysis to identify the root cause of the problem. Develop and implement corrective actions: The team develops a plan to correct the root cause of the problem and implements the necessary changes. Verify the effectiveness of the corrective actions: The team monitors the process to ensure that the corrective actions have been effective and that the problem does not recur. Update the process: The team updates the process to prevent similar problems from occurring in the future. The OCAP process can be used to improve the quality of products or services, reduce waste, and increase efficiency in the organization. By systematically addressing issues that are outside the normal process control limits, organizations can continuously improve their processes and products, which can lead to increased customer satisfaction, improved profitability, and a competitive advantage in the marketplace.
-
Suresh Kumar Gupta replied to Vishwadeep Khatri's topic in We ask and you answer! The best answer wins!Evolutionary Operation (EVOP) is a method of process optimization that involves a trial-and-error approach to identify the optimal settings of the process variables. The method involves making small, incremental changes to the process parameters and then observing the effect of these changes on the process output. This process is repeated until the desired output is achieved. Steps involved in implementing an EVOP experiment: Define the objective: The first step in implementing an EVOP experiment is to define the objective of the process optimization. The objective can be to maximize the yield, minimize the cost, or improve the quality of the product. Select the process variables: The next step is to identify the process variables that have a significant impact on the process output. These variables can be the temperature, pressure, flow rate, pH, or any other relevant parameter. Define the process limits: The process limits define the range of values within which the process variables can be varied. These limits are typically set based on the operational constraints of the process and the desired output. Conduct the experiment: The EVOP experiment involves making small, incremental changes to the process variables and then observing the effect of these changes on the process output. The changes are typically made using a factorial design, which involves changing one variable at a time while keeping the other variables constant. Analyze the results: The results of the EVOP experiment are analyzed to identify the optimal settings of the process variables that produce the desired output. This analysis involves statistical methods, such as regression analysis and ANOVA. Advantages and disadvantages of EVOP compared to Design of Experiments: Advantages: EVOP is a simple and cost-effective method of process optimization, requiring only a few trials to identify the optimal process parameters. EVOP is particularly effective for improving existing processes, as it can identify the most critical variables and their impact on the process output. EVOP can be useful for identifying interactions between the process variables that are difficult to identify using other methods. Disadvantages: EVOP is not suitable for optimizing complex processes with a large number of variables. EVOP does not provide information about the relative importance of the process variables. EVOP relies on trial-and-error, which can be time-consuming and may not always identify the optimal solution. Example: A chemical company wants to optimize the yield of a chemical reaction. The process variables that affect the yield are the temperature, pressure, and concentration of the reactants. The company conducts an EVOP experiment by varying these variables within their process limits and measuring the yield. After several iterations, the company identifies the optimal settings of the process variables that produce the maximum yield. The company can then implement these settings in their process to achieve the desired outcome.
-
Suresh Kumar Gupta replied to Vishwadeep Khatri's topic in We ask and you answer! The best answer wins!Workload balancing refers to the process of distributing workloads among workers or resources in order to achieve optimal utilization and efficiency. This is important in both the manufacturing and service industries as it helps to optimize resource utilization, reduce costs, and improve quality. In manufacturing, workload balancing involves ensuring that machines, equipment, and personnel are effectively allocated to achieve maximum efficiency. This can involve tasks such as scheduling, routing, and monitoring production processes to ensure that resources are being used efficiently. In the service industry, workload balancing involves allocating tasks and resources to employees in order to ensure that customer needs are being met efficiently. This can involve tasks such as scheduling appointments, managing customer queues, and ensuring that employees are trained to handle a variety of tasks. When implementing workload balancing in either industry, there are several considerations that need to be taken into account. These include the size of the organization, the type of tasks being performed, the availability of resources, and the overall goals of the organization. Technologies like AI and Machine Learning can help organizations with workload balancing. These technologies can analyze data and patterns to help predict workload demands and optimize resource allocation. For example, Machine Learning algorithms can be used to analyze historical data on production processes or customer demand in order to make more accurate predictions about future workload demands. AI can also be used to automate certain tasks, such as scheduling and routing, which can help to reduce the workload on human workers and free up time for more important tasks. In addition, AI can be used to monitor and optimize the performance of production equipment or service delivery processes, helping to improve efficiency and reduce costs. Overall, workload balancing is an important process in both the manufacturing and service industries. By optimizing resource allocation and improving efficiency, organizations can reduce costs, improve quality, and better meet the needs of their customers. Technologies like AI and Machine Learning can play a key role in helping organizations achieve these goals.
-
Suresh Kumar Gupta replied to Vishwadeep Khatri's topic in We ask and you answer! The best answer wins!The Is/Is Not Analysis is a tool used for root cause analysis that helps identify the possible causes of a problem by examining what is and what is not true about the problem. This technique can be particularly helpful when the cause of a problem is not immediately obvious. The Is/Is Not Analysis is different from the other typical tools like 5 Why or Fishbone Diagram in that it focuses on gathering information about the problem by systematically identifying and exploring what is and what is not related to it. The 5 Why technique involves asking a series of "why" questions to uncover the root cause of a problem, while the Fishbone Diagram helps identify potential causes of a problem by categorizing them into various categories. The Is/Is Not Analysis is most suited for situations where there is uncertainty or ambiguity about the cause of a problem. It can be particularly helpful when a problem is complex and has many potential causes that need to be explored. This technique can be used in any industry or field where problem-solving is required, including healthcare, engineering, manufacturing, and business. Example :- Let's say a manufacturing company is experiencing a high defect rate in their products. They can create an Is/Is Not Analysis table to gather information about the problem. In the "Is" column, they might list the defects that are occurring, while in the "Is Not" column, they might list the aspects of the manufacturing process that are not related to the defects. By systematically exploring these two categories, they can narrow down the potential causes of the problem.
-
Suresh Kumar Gupta replied to Vishwadeep Khatri's topic in We ask and you answer! The best answer wins!Transportation waste and motion waste are two of the eight types of waste identified in the Lean methodology. Transportation waste is any unnecessary movement of goods or materials, while motion waste is any unnecessary movement of people or equipment. Here are some examples of transportation waste and motion waste in both manufacturing and service sectors: Manufacturing sector: Transportation waste: Transporting raw materials from one warehouse to another without any value-adding process in between Shipping finished goods to a warehouse that is far away from the end customer, resulting in long lead times and increased transportation costs. Motion waste: Unnecessary movements of workers to retrieve tools, parts, or equipment Multiple employees working on the same machine at different times, resulting in wait times and lost productivity. Service sector: Transportation waste: Sending unnecessary emails or documents back and forth between different departments within a company Employees commuting to work from distant locations, resulting in wasted time, money, and energy. Motion waste: Excessive walking or searching for files, documents, or supplies in an office or workspace Repeatedly asking the same questions or seeking clarification due to unclear communication or processes. There are several ways to handle transportation and motion waste: Streamline processes and layouts to minimize the distance traveled by goods, materials, or people. Use technology to automate or digitize tasks to reduce unnecessary movements and human error. Adopt a "just-in-time" approach to inventory management to reduce the need for storage and transportation of excess materials or finished goods. Implement a culture of continuous improvement and employee involvement to identify and eliminate waste at all levels of the organization. Train employees on efficient and ergonomic work practices to minimize unnecessary motion and physical strain.
-
Suresh Kumar Gupta replied to Vishwadeep Khatri's topic in We ask and you answer! The best answer wins!Demand leveling and production leveling are two approaches to managing operations that aim to balance demand and supply in order to improve operational efficiency, reduce costs, and increase customer satisfaction. However, they differ in their focus and methods. Demand leveling, also known as demand management, is the process of smoothing out fluctuations in demand over time, by either stimulating demand during low periods or slowing down demand during high periods. This is typically achieved through strategies such as price discounts, promotions, and incentives to encourage customers to purchase during off-peak times, or by using inventory management techniques to manage supply and meet demand. On the other hand, production leveling, also known as production planning, is the process of balancing the rate of production with the rate of demand. This is typically achieved through methods such as standardizing work processes, optimizing production schedules, and reducing waste and variability in the production process. Both demand and production leveling have their limitations as a strategy for managing operations in a dynamic business environment. The limitations of demand leveling are that it can be difficult to predict customer demand accurately, especially in rapidly changing market conditions, which can lead to overproduction or underproduction. Additionally, demand leveling can result in higher inventory carrying costs and reduced flexibility, as companies may need to stockpile excess inventory during peak periods. Similarly, the limitations of production leveling are that it can be difficult to adapt to sudden changes in demand or supply, which can lead to shortages or surpluses. Additionally, production leveling can limit innovation and responsiveness to changing market conditions, as it often involves standardizing work processes and reducing variability in the production process. To optimize their operations, organizations need to balance the trade-offs between these two approaches. One way to achieve this balance is to adopt a hybrid approach, which combines elements of both demand and production leveling. For example, a company may use demand leveling strategies to smooth out fluctuations in demand, while also using production leveling strategies to optimize production schedules and reduce waste in the production process. Another way to balance these two approaches is to use technology and data analytics to better predict and respond to changes in demand and supply. By using real-time data and analytics, companies can optimize their production schedules, manage inventory levels more effectively, and respond more quickly to changing market conditions. Ultimately, the key to optimizing operations in a dynamic business environment is to be agile, adaptable, and responsive to changing customer needs and market conditions. By adopting a flexible and data-driven approach to operations management, companies can balance the trade-offs between demand and production leveling, and achieve a more efficient and profitable operation.
-
Suresh Kumar Gupta replied to Vishwadeep Khatri's topic in We ask and you answer! The best answer wins!Conjoint analysis is a statistical technique used in market research to measure how customers value different attributes (or features) of a product or service. It is based on the idea that consumers evaluate a product or service as a whole rather than on individual features. By understanding how customers weigh different attributes, businesses can make informed decisions about product design, pricing, and marketing strategies. Conjoint analysis works by presenting customers with a series of hypothetical product profiles that vary in their attributes, such as price, quality, size, or color. Customers are then asked to rank or rate these profiles based on their preferences. The results of these surveys are analyzed using statistical techniques to estimate the relative importance of each attribute and the ideal combination of attributes that would maximize customer satisfaction. Conjoint analysis can provide valuable insights into customer preferences and help businesses make strategic decisions, such as: Product Design: By understanding which features are most important to customers, businesses can design products that meet their needs and preferences. Pricing: Conjoint analysis can help businesses determine the optimal price for their products by analyzing how customers value different price points. Market Segmentation: By segmenting customers based on their preferences, businesses can tailor their marketing strategies and product offerings to specific customer groups. Branding: Conjoint analysis can help businesses understand how customers perceive their brand and identify areas for improvement. Overall, conjoint analysis is a powerful tool for businesses to gain insights into customer preferences and make informed decisions about product design, pricing, and marketing strategies.
-
Suresh Kumar Gupta replied to Vishwadeep Khatri's topic in We ask and you answer! The best answer wins!When conducting an experiment with five factors, each with two levels, we have a total of 2^5 = 32 possible combinations of levels. A Full Factorial design would require testing all 32 combinations, while a Fractional Factorial design would only test a subset of these combinations. If time and resources are limited, a Fractional Factorial design would be preferred over a Full Factorial design. A Fractional Factorial design would allow us to test the main effects of each factor and their interactions while reducing the number of experiments required. This can significantly decrease the time and resources needed for the experiment. For example, a commonly used Fractional Factorial design for 5 factors with two levels each is the 2^5-2 design, also known as the "half-fraction" design. This design only requires testing 16 out of the 32 possible combinations, while still allowing us to estimate the main effects and two-way interactions of all five factors. The complexity of the experiment would also be reduced with a Fractional Factorial design. With a Full Factorial design, it can be difficult to keep track of all the possible combinations and their results, making it harder to analyze the data. A Fractional Factorial design simplifies the experimental setup and analysis, making it easier to interpret the results. Overall, if time and resources are limited, a Fractional Factorial design would be a more practical approach than a Full Factorial design for an experiment with five factors and two levels each.
-
Suresh Kumar Gupta replied to Vishwadeep Khatri's topic in We ask and you answer! The best answer wins!The number of bot licenses required for an RPA deployment depends on several factors such as the number of processes to be automated, the complexity of those processes, the frequency of execution, the number of employees involved in the process, and the desired throughput. To illustrate, let's consider an example of a financial organization that wants to automate its invoice processing system. Suppose the organization receives 10,000 invoices per month, and the process involves data extraction from invoices, data validation, and invoice payment processing. The process takes an average of 5 minutes per invoice for a human worker. So, it takes around 50000 minutes (833 hours) per month for processing invoices. Now, if we use an RPA bot that can process an invoice in 1 minute, it would take only 10,000 minutes (167 hours) per month, which is a significant reduction in processing time. Assuming that the bot works for 8 hours a day, five days a week, and four weeks a month, it can process 9600 invoices per month. Therefore, the organization would need at least two bots to process all 10,000 invoices per month. However, the organization may also consider other factors such as the scalability of the process, the likelihood of increased volumes of invoices, the risk of bot failures, and the potential impact of human errors on the process. In conclusion, the number of bot licenses required for an RPA deployment depends on several factors, and organizations must carefully evaluate these factors to determine the optimal number of licenses needed to achieve the desired ROI.
-
Suresh Kumar Gupta replied to Vishwadeep Khatri's topic in We ask and you answer! The best answer wins!The Harada Method is a framework developed by Takashi Harada, a Japanese management consultant and author, to help individuals and organizations improve their performance and achieve their goals through self-reliance and continuous improvement. It is a holistic approach that combines personal development, leadership training, and process improvement methodologies such as Lean and Six Sigma. The Harada Method is based on the principle of self-reliance, which means that individuals take ownership of their own development and actively work to improve their skills and knowledge. The framework consists of six steps: 1. Set a goal: The first step is to define a clear and specific goal that is challenging yet achievable. 2. Develop a plan: Next, individuals develop a plan that outlines the steps they will take to achieve their goal. 3. Acquire knowledge and skills: In this step, individuals identify the knowledge and skills they need to achieve their goal and actively work to acquire them. 4. Take action: Once individuals have the necessary knowledge and skills, they take action to implement their plan and work towards their goal. 5. Evaluate progress: Individuals regularly evaluate their progress towards their goal and make adjustments to their plan as needed. 6. Persevere: Finally, individuals persevere in the face of challenges and setbacks, using them as opportunities to learn and improve. Organizations can use the Harada Method to improve their Lean Six Sigma implementation strategy by applying the same six steps to their improvement efforts. By setting clear goals, developing detailed plans, acquiring the necessary knowledge and skills, taking action, evaluating progress, and persevering, organizations can achieve measurable improvements in quality, efficiency, and customer satisfaction. The Harada Method can also help organizations develop a culture of continuous improvement and empower employees to take ownership of their own development and improvement.
-
Suresh Kumar Gupta replied to Vishwadeep Khatri's topic in We ask and you answer! The best answer wins!Randomization is a technique used in statistics to ensure that study participants are assigned to different groups in an unbiased and random manner. There are four types of randomization in statistics: simple randomization, blocked randomization, stratified randomization, and adaptive randomization. 1.Simple randomization: In simple randomization, participants are randomly assigned to treatment or control groups without any constraints or restrictions. The simplest method of randomization is to use a computer-generated random number generator or a randomization table to randomly assign participants. Criteria for using simple randomization: Simple randomization is useful when the sample size is relatively small, and there are no other variables that need to be controlled. It is typically used when a researcher wants to investigate the impact of a single intervention, such as a new drug or therapy. Example: Suppose a researcher is conducting a clinical trial to investigate the effectiveness of a new drug in treating high blood pressure. The researcher could use simple randomization to randomly assign participants to either the treatment group or the control group. 2.Blocked randomization: In blocked randomization, participants are divided into small groups or blocks, and then randomly assigned to the treatment or control group. The number of participants in each block is usually fixed and predetermined. Criteria for using blocked randomization: Blocked randomization is useful when the researcher wants to control for certain variables that may affect the outcome of the study, such as age or gender. It is also useful when the sample size is relatively small. Example: Suppose a researcher is conducting a clinical trial to investigate the effectiveness of a new drug in treating a certain disease. The researcher could use blocked randomization to ensure that each block contains an equal number of male and female participants. 3.Stratified randomization: In stratified randomization, participants are first divided into different subgroups based on certain variables, such as age, gender, or medical history. Then, participants within each subgroup are randomly assigned to the treatment or control group. Criteria for using stratified randomization: Stratified randomization is useful when the researcher wants to control for certain variables that may affect the outcome of the study, such as age, gender, or medical history. It is also useful when the sample size is relatively large. Example: Suppose a researcher is conducting a clinical trial to investigate the effectiveness of a new drug in treating depression. The researcher could use stratified randomization to ensure that each subgroup contains an equal number of male and female participants of different age groups. 4.Adaptive randomization: In adaptive randomization, the assignment of participants to treatment or control groups is adjusted based on the outcomes of the study. Participants who have a higher chance of benefiting from the treatment are more likely to be assigned to the treatment group. Criteria for using adaptive randomization: Adaptive randomization is useful when the researcher wants to maximize the effectiveness of the treatment by assigning more participants who are likely to benefit from the treatment to the treatment group. Example: Suppose a researcher is conducting a clinical trial to investigate the effectiveness of a new drug in treating a certain type of cancer. The researcher could use adaptive randomization to assign more participants who have a specific type of cancer to the treatment group, as they are more likely to benefit from the treatment. In conclusion, the choice of randomization method depends on the specific research question, study design, sample size, and other factors. Researchers should carefully consider the strengths and limitations of each method before selecting the most appropriate one for their study.
-
Suresh Kumar Gupta replied to Vishwadeep Khatri's topic in We ask and you answer! The best answer wins!Cognitive analytics is a form of advanced analytics that uses artificial intelligence (AI) and machine learning algorithms to extract insights from large and complex datasets, including unstructured data such as text, images, and video. It goes beyond traditional descriptive (provides a summary of past events), predictive (which uses historical data to predict future outcomes), and prescriptive (provides recommendations on the best course of action to take based on a given set of data.) analytics approaches, which focus on analyzing structured data and makes recommendations based on historical patterns and rules. Instead, cognitive analytics uses natural language processing, data mining, and other AI technologies to simulate human thinking and reasoning, enabling it to identify complex patterns, trends, and insights that traditional analytics methods cannot detect. Below are some examples of how cognitive analytics is being deployed in various industries: 1.Healthcare: Cognitive analytics is being used to help diagnose and treat diseases, such as cancer. By analyzing large volumes of patient data, including electronic medical records, images, and genomics data, cognitive analytics can help doctors identify early warning signs of cancer and provide personalized treatment plans. 2.Financial services: Cognitive analytics is being used to help prevent fraud and financial crimes. By analyzing customer transactions and behavior's in real-time, cognitive analytics can detect patterns and anomalies that indicate fraudulent activity, enabling banks to take immediate action to prevent losses. 3.Retail: Cognitive analytics is being used to personalize shopping experiences and increase customer engagement. By analyzing customer data, such as purchase history, browsing behavior, and social media activity, cognitive analytics can provide personalized product recommendations and marketing messages, increasing the likelihood of sales. 4.Manufacturing: Cognitive analytics is being used to optimize supply chain operations and improve product quality. By analyzing sensor data from machines and equipment, cognitive analytics can identify patterns and trends that indicate potential maintenance issues, enabling manufacturers to take preventative action to reduce downtime and improve product quality. In summary, cognitive analytics is a powerful tool for extracting insights from large and complex datasets, and it is being deployed in various industries to improve decision-making, increase efficiency, and enhance customer experiences.
-
Suresh Kumar Gupta replied to Vishwadeep Khatri's topic in We ask and you answer! The best answer wins!First in Still Here (FISH) is a term that refers to excessive and a very slow-moving inventory. The acronym (FISH) is a take-off on the FIFO (First In, First Out) and LIFO (Last In, First Out) acronyms to describe inventory cost layering systems. The concept of FISH is important to understand as it can indicate whether your business has enough money in its operating capital account or not. If the inventory on hand is too much which is not selling quickly then some of it needs to written off as obsolete or defective and you need to replace it with new items. If this inventory is left unchecked, it can lead to serious financial troubles for your company since cost is involved with old stuff sitting on the shelf. FISH is one of the Six Sigma terms used to describe the movement of products through our supply chain and this concept relies on the fact that if we are able to keep our product moving at a steady pace through our supply chain, it will increase our chances of success by preventing bottlenecks and reducing inventory costs. If a business has a large amount of FISH inventory it indicates excessive working capital has been invested due to which it poses a high risk for outdated inventory which needs to be written off. Industry Examples 1. The food industry is famous for overstocking unpreserved food items and the waste is not only financial but environmental as well. Every year around 30% of food purchased and 45% of crops harvested are wasted industry-wide and this translates to over $160 billion wasted annual in the US alone. 2. Fashion and beauty industries have a disturbing trend with increasing loss figures year over year due to unsold inventory and wasted products This is not the case with only individual companies that struggle with their inventory, it is to do with entire industries. Businesses that are Item-based are made or broken almost exclusively on the back of their inventory management practices. So to reduce the amount of First in Still Here (FISH) inventory, companies need to consider their products’ life cycles and the costs involved with keeping the product on hand as inventory and also costs associated with ordering more when needed. Challenges Some of the causes for Fish Inventory could be due to unexpected low sales, excessive inventory purchases and Poor management of materials. There are three main challenges why FISH can be harmful problem for many businesses. 1. If there is an excess amount of inventory on hand then there is a possibility the item may not be sold and may go out of date Products having long shelf lives and/or low demand or sitting on your shelf for long time are less likely to get sold at full price. 2. Poor materials management within the business itself. Over-ordering materials and/or making mistakes in purchasing decisions leading to have more than what you need for current production levels. 3. Sales are lower than expected—or that they will be. Due to unexpected low sales in future businesses will want to reduce their current stock levels in order to avoid writing off outdated product later down the line Best practices - FISH The world of business is all about staying ahead of the competition and maintaining a competitive advantage. In order to overcome the above challenges, it’s important to think about first in, still here (FISH) inventory in terms of tested and proven below best practices. 1. Consider re-evaluating your inventory management system. This practice can tell us if there is a way to reduce the amount of time it takes for products to move through our warehouse and into customers’ hands. 2. Try implementing FIFO (first in first out) policy or LIFO (last in first out) policy. This practice can enable us to minimize the overall age of our inventory at any given time. 3. Look at ways to optimize your supply chain. This can be done by working with multiple suppliers instead of just one or two so that our product flow isn’t dependent on any one supplier going down or having problems with their delivery schedule. To conclude FISH is an important concept for businesses to understand because it can have a massive impact not only on the inventory management strategy but also the overall success of the business
-
Suresh Kumar Gupta replied to Vishwadeep Khatri's topic in We ask and you answer! The best answer wins!Metcalfe's Law is a concept generally used in computer networks and telecommunications to signify the value of a network. Metcalfe's Law states that the network's impact is the square of the number of nodes in the network. Example Let say if a network has 10 nodes then it’s inherent value becomes 100 (10 * 10), if we add one more node the value is 121 and further adding one the value jumps to 144. In other words, a network's value increases exponentially with size i.e. participation enhances with more people usage. Examples of nodes can be computers, servers and/or connecting users. In the world of digital networks, the exponential growth of the network is considered a good thing but when we talk of social interactions it has a different side to it. Let’s see how Metcalfe's law translates into social interactions in Organization’s. For 3 members the number of communication lines is 3, if we add one more member then the number of efficient communication lines suddenly doubles from 3 to 6. Similarly, for a team of five team members there would be 10 such communication lines at play and when we double the number of team members to ten, we would have a complex network of 45 communication lines. We can make out from this law that as more & more people try to communicate with each other, the number of interactions increases enormously. Due to this a problem arises and our brain simply can't handle this. Our structure of the mind is such that it can't really handle very large numbers of relationships, there is a limit to the number of people we can communicate, coordinate and perform with, there are limits to the number of colleagues we happily can drink coffee with, and even fewer we invite people over for dinner. So we can conclude from this law that It is better to have small teams so that members do not get overloaded with communication and information which our brains can't handle.
-
Suresh Kumar Gupta replied to Vishwadeep Khatri's topic in We ask and you answer! The best answer wins!Below are the differences between Cohen's Kappa and Fleiss Kappa: - · Fleiss Kappa works for any number of raters whereas Cohen's Kappa only works for two raters · One of the important requirement of Fleiss Kappa is that each rater needs to rate different items, while Cohen's Kappa both raters need to rate identical items. · Fleiss Kappa can lead to paradoxical results namely that, even with nominal categories, reordering the categories can change the results. But Cohen's version lead to odd results when there are large differences in the occurrence of possible outcomes Example 1: - Let’s us take a response variable (categorical scale) with three values: yes, maybe, no and there are two raters. Both the raters are used to judge all observations. For Cohen’s Kappa there should be 2 raters and the same 2 raters judge all observations. So we in this scenario Cohens' kappa is suitable Example 2: - In the same example above let say there were three raters and different raters judge all observations. In Fleiss' kappa case, there should be 3 raters or more and the raters should be non-unique which is the above case so in this scenario Fleiss Kappa is suitable.
-
Suresh Kumar Gupta replied to Vishwadeep Khatri's topic in We ask and you answer! The best answer wins!A violin plot is a mixture of a box plot and a kernel density plot that displays the peaks in the data. Violin plot is used to visualize the distribution of numerical data and is more informative than a plain box plot since a box plot only shows summary statistics such as mean/median and interquartile ranges whereas violin plots depict summary statistics and the density of each variable. Whenever you want to observe the distribution of numeric data or make a comparison of distributions over multiple groups Violin plots are preferred over Box Plot. The peaks, valleys, and tails of each group's density curve in Violin plot can be compared to see which groups are similar or different.
-
Suresh Kumar Gupta replied to Vishwadeep Khatri's topic in We ask and you answer! The best answer wins!Control Limits Vs Specification Limits · Control limits represents the voice of the process whereas the Specifications Limits represent the voice of the customer and talks about SLA/tolerance and tells us acceptance/rejection criteria · Control limits can be calculated from Data (Control Limits = X + 3S, X-3S) while Specifications Limits is defined by customer and it is always given (No formula to calculate Specifications limits) · Control limits appear on control charts where control limits are for the sample averages whereas Specifications Limits appear on histograms, box plots, or probability plots. Specification limits are for individual values · Control limits apply to subgroups, guide for process actions and tells us what the process is doing whereas Specification Limits apply to items, separate good items from bad and tells us what we want the process to do
-
Suresh Kumar Gupta replied to Vishwadeep Khatri's topic in We ask and you answer! The best answer wins!Crossed GR&R Designs This design is used when the same parts can be measured multiple times by each operator (Figure 1). This is generally to check how much process variation is due to measurement system variation. Crossed GR&R design is used for non-destructive scenarios—where parts are not destroyed during measurement and can be used to measure twice. Examples: - 1. A company assembles wire connectors. The final wire length is measured in mm manually by operators. Measurement by the same gage is carried out for three parts by three different operators. 2. An engineer selects 10 parts that represent the expected range of the process variation. All three operators can measure all the 10 parts 3 times per part in random order 3. The manager of a fitness centre wants to offer body fat percentage measurement to clients. Because skinfold thickness is easily measured and correlates highly with total body fat, the manager decides to purchase a skinfold caliper and teach his fitness trainers to perform these measurements. 10 Clients with varying amounts of body fat participate in the MSA performed by 2 trainers measuring the triceps skinfold thickness 2 times each in random order In all the above examples, each part is subject to repeated measurements. Nested GR&R Designs This design is used where the same part cannot be used for repeated measurements as the parts get destroyed on testing when only one operator measures each part (Figure 2). This design is called nested because one or more factors are nested under another factor and not crossed with the other factors. Nested GR&R design is used for destructive testing scenarios. Examples: -, 1) Measuring the effect of a drug by dissolving it in a chemical. 2) Assessing the device used to measure the blood clotting time in a hospital laboratory where a manager selects blood samples the represent the expected range of variation. He assigns 3 technicians to perform the assessment and each sample is unique i.e. no two technicians measure the same sample. They measure 5 samples each for total of 30 m3easurements. 3) An engineer assigns 3 randomly selected operators to monitor the impact strength of ceramic components. The engineer selects 30 samples randomly and gives 10 random samples to each of the operators. In all the above examples, the sample is destroyed during testing, making it impossible to test the sample again.
-
Suresh Kumar Gupta replied to Vishwadeep Khatri's topic in We ask and you answer! The best answer wins!Lean Six Sigma experts usually suggest to take a target for improvement in mean as compared to median because of the following reasons: - · Population Data is used for analysis · Approach is decision based · Focus is on achieving on project goals · The mean has a direct relationship with the total (total = mean x N), but the median does not that is why it difficult to move the needle with median · Outliers present in the data can be taken care of by understanding the reason and if it is result of measurement error we can exclude it from analysis so that there is no impact on Mean Let’s consider the following examples involving skewed data Example 1: Lotteries Which one of the below two games would you choose to play? Game A: · A 1/3 chance of winning $1 · A 1/3 chance of winning $2 · A 1/3 chance of winning $3 Game B: · A 1/3 chance of winning $1 · A 1/3 chance of winning $1.90 · A 1/3 chance of winning $1,000,000 It was found that most people preferred Game B even with lower median ($1.90 vs. $2.00). After looking at the data set although the distribution is skewed we should prefer using mean over median since for Game B $1,000,000 is an extreme value and is part of the distribution and relevant for decision-making. One shouldn’t take the decision based on the 1 in 3 chance of becoming a millionaire with Game B. Example 2: A Company wants to increase its Headcount resource A company is planning to hire 300 new employees and to estimate the total cost of the initiative. Salaries data distribution would tend to be skewed and we can expect that the mean salary of new jobs would be larger than the median. Considering the data distribution of salaries to be skewed the manager of the company decides to use Median and to estimate the total cost of hiring the new employees he multiplies median with 300. The actual cost turned out to be much higher than their estimate since the Manager had used Median and not mean. In this example Company was more interested in the total cost of hiring the new employee and Manager should have used Mean since it has a direct relationship with the (total = mean x N), but the median does not. In this case, the company was interested in a total. The mean has a direct relationship with the total (total = mean x N), but the median does not. So we can conclude that mean should be preferred over median as a better metric whenever the analysis is driven by goals and business decision’s depends on a total (total revenue or total sales) since it has direct relationship with the total. Also Means are sensitive to large values and care should be taken to ensure that outliers if any are taken care of.
-
Suresh Kumar Gupta replied to Vishwadeep Khatri's topic in We ask and you answer! The best answer wins!For Continuous Data Zoverall (Overall Performance) and Zwithin (Within Performance) can be calculated independently because of which Sigma Shift approximation of 1.5 usually unsuitable for continuous data. However, for Discrete Data we cannot calculate the Zoverall (Overall Performance) and Within (Within Performance) independently and we have to take Sigma Shift approximation of 1.5.
-
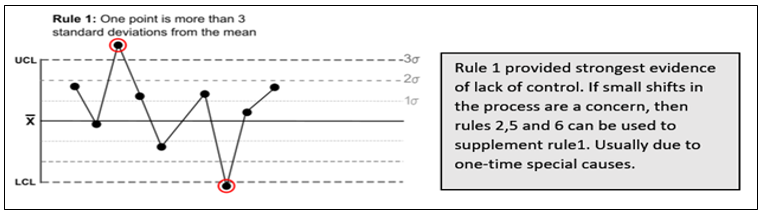
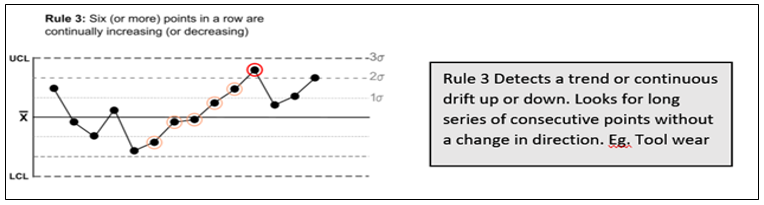
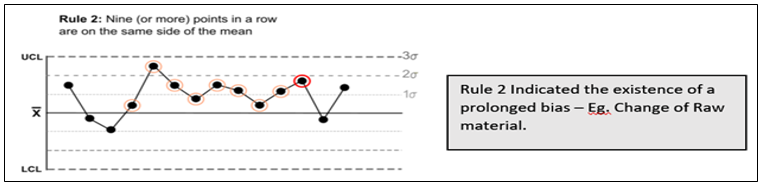
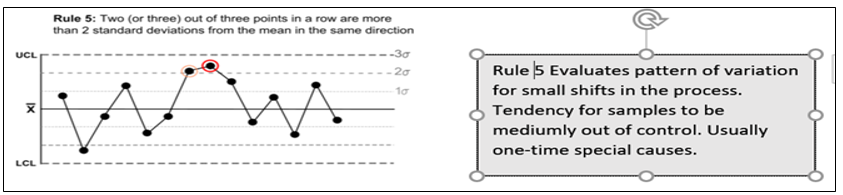
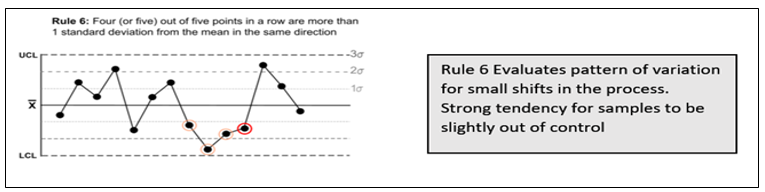
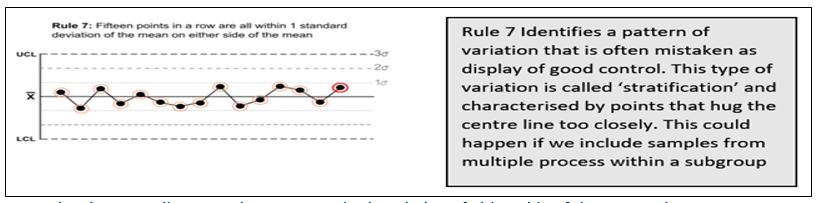
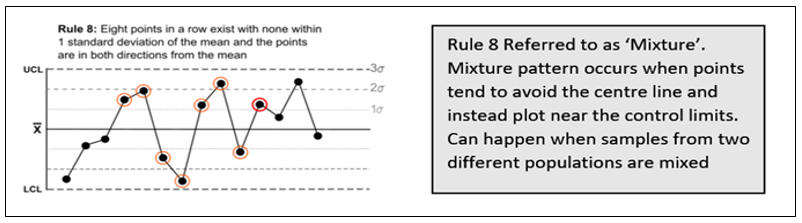
Suresh Kumar Gupta replied to Vishwadeep Khatri's topic in We ask and you answer! The best answer wins!Generally, a process is said to be stable if no observations/data points are lying outside the control limits in Control Chart. However, Lloyd Nelson stated that there is also a possibility of other situations where even though all the points are within the control limits there could be situations indicating the existence of special causes. He came out with 8 rules which would help us identify special causes even in a seemingly stable process. Below are the rules applicable for both Variable & Attribute data to detect any special causes of Variation in the process. 1. One point more than 3 Standard Deviations from the Mean 2. 6 points in a row all either increasing or all decreasing. 3. 14 points in a row alternating up and down. 4. 9 points in a row on the same side of the Mean. These remaining four rules are only for variable data to detect Special Causes. 5. 2 out of 3 points greater than 2 Standard Deviations from the Center Line on the same side. 6. 4 out of 5 points greater than 1 Standard Deviation from the Center Line on the same side. 7. 15 points in a row all within one Standard Deviation of either side of the Center Line. 8. 8 points in a row all greater than one Standard Deviation of either side of the Center Line. While multiple rules are available, it is important to decide which rule needs to be applied when. Rule 1- is the fundamental one and is hence we can start with it for any situation. Subsequently, Rules 2 to 4 comprise a good set that help for many of the commonly occurring special causes for both Variable and Attribute Data. For a Variable data rules 5 and 6 will increase the sensitivity to changes in the process average and Rules 7 and 8 will help to identify problems relating to sampling, viz. stratification and mixtures. So while checking for stability of process one should refer to all rules for Variable Data and only the first four for Attribute Data.

-
Suresh Kumar Gupta replied to Vishwadeep Khatri's topic in We ask and you answer! The best answer wins!Discrete data is data that only takes certain values, data that can be counted and has a finite number of values. Example: Errors count, Hourly Volume processed, No of Students in class etc. which can be counted Below charts can be used for Graphical summary of Discrete Data: - · Column Chart - The most commonly used chart type for discrete data is the column chart. Every column in the chart represent one Value and column height denotes the frequency of the Data value. Example Comparison of monthly employee sales We also have Stacked Column chart used for data composed of multiple column data series stacked on top of one another and is used to compare totals and notice changes at the item level · Bar Chart - Bar charts can also be used for discrete values. Bar charts are represented in horizontal bars and are often a better choice when we have long text labels which cannot be represented well in Column chart. Example A single-series chart in which the values are compared inside one category. We also have Stacked Bar chart composed of multiple bar series stacked horizontally one after the other which makes it easier to track the variation in the individual values and their total value. · Pie Chart - Pie Chart also works well for displaying discrete data, as all the values combined equal 100 percent of the total. If you want to display your values as percentages of the total, then Pie Chart is best option. Pie charts is not recommended if there are too many small values as it becomes difficult for the reader to make sense of the chart. · Spider Chart - It’s designed for comparing multivariate data that has three or more quantitative variables. Axes for each variable start from center point and are arranged radially around it like a spider web. It’s the process of plotting a polygon. Example - Employee Skill Assessment · Histogram - When you have a large set of discrete data that doesn't fit on a regular chart, you can use a histogram to display the distribution of the values.
