Nunhuck Oosman
Members
-
Joined
-
Last visited
-
By finding and embracing a purpose or job that advances their progress, employees can be successful using the Harada method, which addresses the human element of Lean. By addressing the 8th Waste of Lean, the underutilization of people's creative talents, the Harada Method may be employed to achieve complete collaboration for a business's Lean efforts. It encourages people to take control of their lives so they can develop strong work skills and complete independence. It demonstrates how both the business and each person may achieve success. Harada was a track and field instructor in an underwhelming junior high school in Osaka, Japan. He noticed as a coach that his athletes were being outperformed by pupils from other schools. No amount of encouragement improved his runners' performance. Harada was aware that his students' perspectives needed to alter. He researched how effective teams, coaches, and leaders operated. He developed a strategy that enabled his students succeed more as a result of these studies. The Harada methodology was created with the intention of preparing each pupil (or worker) to be an excellent leader and coach who can assemble a successful team. This approach is consistent with Six Sigma and various continuous improvement-oriented methodologies and tools. The secret to the strategy is to request that each employee select a life goal they want to achieve. It calls on everyone to master a specific ability. People have something to aim for when they go to work because of it. It is a well-planned, step-by-step procedure that aids in helping people transform so they can succeed for both themselves and their businesses. The Harada method's core value is self-reliance, or people's ability and confidence to develop their talents to the point where they are essentially irreplaceable. They are able to apply their skills for both their own and the organization's advancement because to their self-confidence. One can rely on these workers to make wise, educated decisions. As the employees themselves establish the goals, there is no doubt as to who is responsible for achieving these objectives. The Harada method promotes development at all organizational levels in implementing Six sigma Strategy which include the following: It transforms managers into coaches and leaders. In addition to raising one's skill level, it also helps one develop a vision for their long-term success as a person. This technique teaches people how to develop more manageable goals after they have a clear picture of what they're seeking to accomplish. As people strive for achievement, their self-esteem rises, which motivates them even more to perform better. Also, it raises their confidence. Repeating success is simpler once the future course is clear. Any person has the potential to succeed. The Harada method emphasizes self-reliance; people should develop themselves to the point where success comes naturally. This can be accomplished via enhancing a person's character, abilities, health, and way of life. Yet, success cannot be attained unless a one puts up the effort to do so. Whether it's data entry or tricky machinery operation, the people must be able to master the talent they're working on. After a talent is acquired, the person can refine it and make sure it is used regularly. The Harada technique guides a person through the following five phases: Selecting a skill in advance that one wants to master Personal achievement: mastering the selected ability Set objectives: Establishing goals for accomplishing excellence Selfless deeds: giving the assignments your all Self-reliance is the ability to rely on oneself to carry out tasks and achieve goals. The top level steps that foster independence are defined by the Harada method. Choose a goal, create a timeline, and make a strategy to reach the goal. There are several recommendations people should adhere to in order to accomplish their goals: People should choose objectives that are consistent with both their own personal and organizational ambitions. The hardest stage is choosing a goal because doing so involves committing to it and running the risk of failing. Assuring that the objective is in accordance with the company's aims can help to aid success and make it simpler to get the backing of your managers and coworkers. Finally, create a schedule for completing the task. A realistic timeline must be established else the timeline will be unsuccessful if the deadline is overly aggressive or loose. Implement the essential progress-monitoring procedures. People still can not know whether or not they're successful without monitoring. For instance, if the objective is to pack ten items in 2 hours, check to determine if the assignment is halfway completed at the start of the first hour.
-
Simple randomization Simple randomization is unpredictability that relies on one sequence of the arbitrary assignments. This method keeps the allocation of such a subject to something like a specific group completely random. Flipping a coin is the most popular and fundamental easy randomization method. For instance, when there are two experimental groups (controlled versus treatment), each participant is based primarily on which side of the coin comes up heads (control) or tails (treatment). Alternative strategies involve rolling a die or using a shuffled deck of cards (for example, even-control or odd-treatment). For the straightforward randomization of participants, it can alternatively utilize a random number table from a statistical book or computerized software for numbers. Randomization in blocks "The block randomization approach is intended to randomly assign people to groups so that the sample sizes are equal. Using this technique, sample size distribution among groups is maintained over time. Because of the tiny size and balance of the blocks as well as the planned groupings, there is always a similar number of participants in each group. The researcher chooses the block size, which should be multiplied by the group count as such there will be groups of 2 treatments, size of block will be either 4, 6 or 8. The optimal way to employ blocks is in smaller increments so that researchers will smoothly maintain balance. Once the size of block is establish, all feasible balanced assignment combinations inside the block are considered. It is necessary to determine an equal number for each group within the block. The patients are then divided into the groups using a random selection of blocks. Randomization by stratification The stratified randomization process utilizes care of the issue of balancing and regulating the impact of covariates. By using this technique, groups of subjects' initial characteristics can be balanced (covariates). The researcher must specify the covariates after considering the potential impact each covariate may have on the variable which is dependent.By establishing an independent block for every combination of variables, stratified randomization may be achieved, and participants are then randomized to the correct block of covariates. Simple randomization is used inside each block to divide individuals into the groups after each subject has been identified and allocated to a block. Randomization with adaptation Simple randomization, with or without accounting for the classification of prognostic variables, may contribute to the imbalance of significant variables between treatment groups in clinical studies of small to moderate size. Covariate imbalances are crucial because they have the potential to affect how a findings of the study is interpreted. Covariate adaptive randomization has been put out by a number of researchers as a valid alternative to randomization in clinical research. The consecutive assignment of a new subject to a particular treatment group in randomization with adaptation takes into account the designated covariates and participant assignments from earlier trials. When using covariate adaptive randomization, the sample size divergence of various covariates is measured using the minimization method. Industrial setting for randomization Many businesses have employed randomization to make sure that operations operate as efficiently as possible. For instance, several airlines schedule flights using randomization. Which aircraft and members of the crew will fly on which routes are chosen using randomization techniques. This helps to avoid overbooking and guarantees on-time flight arrival. Randomization methods are frequently used in the manufacturing sector to assess various raw material and processing combinations. For instance, an automaker might try with several oils or lubricants during a production process to see which mixture suits their requirements the best. Finding the best option for their functioning is the aim. Randomization is also used in the banking and finance industries to enhance processes. To determine the best strategy for lowering the risk involved with card payments or automated payments, banks may utilize randomization algorithms. Companies can create strategies that reduce potential costs while maximize earnings by evaluating multiple scenarios. Randomization, though, is not always carried out perfectly. These are some recommendations for optimal practices. 1. Not all variables, such as a customer's background or attitude, may be taken into account during randomization, which could result in distorted or inconclusive results. 2. Not all process improvement methods are well suited to randomization. Think about using other methodological approaches as appropriate 3. Randomization prevents bias from seeping into test results, but it leaves room for potential confirmation bias. When someone looks for evidence to support their opinions or prejudices, confirmation bias may result. Randomization can make sure that all inputs are equally represented, eliminating any potential bias, by gathering a set of inputs, including materials, and thereafter randomly assigning them to a certain output, such as the item being made.
-
FISH is used to describe inventory that moves extremely slowly. This could be a problem because it suggests that working capital investments in inventory are excessive and that there is also a high danger of obsolete inventory. The phrase is an abbreviation for the inventory cost layering methods known as LIFO (Last In, First Out) as well as FIFO (First In, First Out). When a company has a lot of FISH inventory, there is a considerable chance that some of it may become obsolete and need to be written down. There may be an extra operating capital investment in inventories if there is a lot of FISH. Unexpectedly poor sales and overstocking purchases are only two of the many factors that contribute to FISH inventory. Poor efficiency in this area might also be caused by poor materials management. There may be accounting problems if the same things have been idle in stock for a long time. For instance, degradation or obsolescence may cause the things' worth to be lower than their costs. The business also continues to pay other expenses related to storing inventory, such as rent, insurance, and the cost of capital. Businesses that practice First In, Still Here (FISH) accounting have lower turnover rates than the industry standard. Investors typically stay well away of businesses that are in FISH conditions since they are having excess inventory costs money. The challenges of FISH are as follows. 1. It implies that an ample supply of available inventory that might not be sold before it expires. When it comes to products with lengthy shelf periods and/or low demand, this is frequently the case. Less likely are you to sell a product at full price the longer it remains on your shelf. 2. It suggests inadequate material management within the company itself. If you've had a lot of FISH available, it's likely that you over-ordered supplies or made poor purchasing choices, leaving you with more than you require for your present production levels. 3. It implies that sales are or will be lower than anticipated. Additionally, this implies that future sales might not be as high as anticipated. Therefore, companies will seek to lower their existing stock levels to prevent writing down outdated goods in the future. FISH affect the effectiveness and efficiency of inventory management supply chain operations as whether the company's operational capital account is sufficiently funded or not. You will need to write off part of your inventory as expired or defective when you've had enough on stock and it is not selling rapidly enough. As a result, you may need to substitute these same items with new ones. However, if you continue to spend all of your money on the old inventory that is idle on the shelf, your business may experience serious financial difficulties. Moreover, one of the Six Sigma words used to describe how goods flow through your supply chain is FISH. The principle is based on the idea that by minimizing bottlenecks and lowering inventory costs, you will boost your chances of success if you can keep your goods moving steadily through your supply chain. In conclusion, it is critical for businesses to comprehend this idea since it can have a significant impact on both the inventory management method and the overall performance of the company. Nearly all of an item-based business' success or failure depends on how well it manages its inventory. Companies need to think about the life cycles of their products, the expenses of maintaining the product on hand, as well as the costs of acquiring more when necessary, in order to limit the quantity of FISH inventory. This is a problem for various markets as well as individual businesses. Perishable food items are renowned for being overstocked in the food sector, and this waste has negative financial and environmental effects. Industry-wide, every year, roughly 30percent of food consumed and 45percent of harvested crops are wasted. This corresponds to an annual waste of approximately $160 billion in the US itself. (Source: Food and Agriculture Organization of the United Nations, 2023) The corporate world is all about keeping a competitive advantage and remaining one step ahead of the competitors. It is crucial to consider FISH inventory in relation of tried-and-true best practices for this reason. Some key benefits of the FISH approach are explained below. 1. Take into account revising the inventory control system. By doing this, the company can learn if there might be a way to advance up the process of getting products from your warehouse into the hands of customers. 2. Consider putting into effect a better LIFO or FIFO policy. As a result, you may be able to reduce the average lifespan of the company’s stock at any particular time. 3. Consider ways to improve the supply chain. Work with several suppliers rather than just one or two, for instance, to ensure that your supply chain is unaffected by any supplier's failure or delivery schedule issues. Customers might not perceive the goods and services as easily available if inventory is too low, which may reduce their likelihood of returning. On the other hand, if the supplies were also excessively high, there might be the need to close down or fire employees because of excessive expenditures. Although there are ideal inventory levels, it is best to make improvements based on the company's unique requirements and indeed the marketplaces in which it compete. When many businesses in numerous industries think about FISH, they immediately think of “JIT - Just In Time” inventories risk and management. But the benefits of having the appropriate inventory are limitless. Using a quality control strategy, identification and correction of errors preamble the results of a company valuable time and money.
-
Whether a corrective, preventive, or predictive maintenance plan is most appropriate for a given product or asset must be determined by maintenance works for any type of asset. Selecting the proper maintenance activity necessitates understanding of each strategy and how it could affect your resources and work schedule because each approach to maintenance has advantages and disadvantages of its own. Equipment breakdowns can be expensive, thus the most logical course of action may seem to be to implement a predictive maintenance policy that anticipates failures and allows for the implementation of corrective action in advance. However, some non-essential equipment might wear out without actually being an issue and can often be quickly and affordably fixed. A maintenance crew may be inclined to acknowledge a corrective maintenance technique under such circumstances. Run to breakdown may also be used when remedial action is impractical. For instance, some spacecraft and satellites may be built with no maintenance assumptions and allowed to operate until they fail (and then abandoned). Preventive maintenance is a third sort of technique that is frequently employed by business. This strategy aims to stop a failure before it happens, similar to predictive maintenance, but there is a small variation between the two, which we go into more depth about below. Management software, such as CMMS Software (Computerized Maintenance Management System), which may help monitor resources in actual time, schedule maintenance, and track work orders, can help organize a condition-based maintenance strategy. Predictive maintenance Because it uses a more thorough method to determine when maintenance is required, predictive maintenance varies slightly from preventive maintenance. Predictive maintenance employs analytics and ongoing data monitoring to identify whether mechanical failure is probable to appear rather than using a specified time or usage pattern to decide when repair is necessary. This kind of monitoring enables maintenance to be carried out as needed to address a particular issue and stop an asset from malfunctioning. Predictive maintenance is frequently more cost-effective than preventative maintenance since it only alerts the user when a malfunction is about to occur. Benefits of Predictive maintenance Lower spending This method eliminates the excessive maintenance costs related to preventative maintenance because maintenance is only carried out when necessary. Since faults are fixed before total equipment failure occurs, maintenance chores are frequently less expensive than with reactive maintenance. By being able to schedule repairs and downtime for equipment, this not only cuts down on the cost of the time spent performing maintenance, but it can also cut down on other costs, including overtime. Higher reliable asset performance If your equipment is properly maintained, it will be more dependable and perform better. By ensuring that your machinery is operating properly, a predictive maintenance solution can lengthen the life of your equipment. Countless other benefits of preventative maintenance, including as improved safety, cost control, energy savings, and reduced disturbance to work schedules, are included in this increased reliability. Reduced downtime This maintenance method can significantly cut down on downtime or outages brought on by failing equipment. Smaller fixes and tune-ups help stop bigger issues from arising, keeping output and customer satisfaction high. Routine Maintenance You can schedule maintenance because you are in command of your equipment's condition. Instead of getting an expensive reactive approach, you can make sure the necessary specialists but also components are on-site when there is time to make repairs. You can also minimize interruptions to workflow to increase productivity and profits. Product Quality Improvement Machines that are not properly maintained can malfunction and produce items that are defective. By keeping an eye on your machinery, you can make sure that every component is working properly and continuously producing high-quality goods. Predictive maintenance have some drawbacks as follows Increasing Initial Costs You will pay more up front for a preventive maintenance program than you would if you let anything wear out on its own. Regular maintenance costs money in terms of time, wages, and parts. You must determine whether this is higher than the possible cost of allowing something to fail naturally, though. Requires knowledge of data interpretation To evaluate the data from your predictive maintenance technology, you'll need qualified personnel. It's crucial to perform your vital data analysis appropriately in order to accurately identify when a problem is about to occur or maintenance is necessary. The equipment and the quality monitoring both require an understanding on the part of your technicians. This can necessitate hiring new employees or undergoing staff training, but these expenses might end up being cost-effective in the medium to long term. Despite the inherent benefits of preventive and predictive methods, corrective maintenance may in some circumstances be the best option. Corrective maintenance is frequently the recommended course of action when the expenditure of part failure and replacement is less than the expenses of preventive or predictive maintenance. Therefore, in the situation of a light bulb, for instance, remedial action is unquestionably the best choice because the expense and time required to change the bulb are not expected to have a significant impact on finances or work schedules. This alters, though, as the component is required for multiple functions, like in the case of a engine’ ships or a blade for a wind turbine. Corrective maintenance can indeed be especially harmful when it doesn't actually been selected as a course of action; allowing something to fail inadvertently can be expensive in terms of time, money, and safety. When the cost of waiting for something to break is too high, a part is too important, difficult to replace, or could seriously affect health and safety of employees or work schedules, preventive monitoring is used. Although this method is not required for all things, it enables the maintenance of that are more significant. This will lessen the possibility of unplanned outages, increase the asset's lifespan and performance, and make it easier to identify any unanticipated causes of failure. Predictive maintenance is becoming the strategy of choice for asset owners. It not only provides many of the advantages of preventive maintenance, but it also performs it in a more effective and economical way. A condition-based control method can be used to notify you only when measures are needed, minimize unnecessary maintenance fees while preserving your equipment in excellent condition. Although there are expenses associated with setup, after these have been budgeted for, they can be used. Sensors can be employed to remotely control a variety of operating factors, including oil quality, vibration, and cracking. As technology evolves, monitoring and data collecting performance improves at a lower cost, this kind of maintenance is becoming increasingly accessible. Which monitoring strategy to use will depend on the organization and the application. While taking a corrective, proactive approach with some objects is completely appropriate and even preferred, many will need this kind of routine maintenance or monitoring. It holds true for every single thing, from little machine parts to huge buildings or structures. The frequency of maintenance examination is determined by preventive maintenance, which might be based on prior inspection data. Maintenance needs for certain assets or objects may also be specified by equipment manufacturers, laws, and even standards. These maintenance plans may need to be modified over time to improve their cost- and maintenance-effectiveness. Motor circuit analysis, laser-shaft alignment, infrared analysis, oil analysis, Vibration analysis and ultrasonic analysis are the six key tools available for predictive maintenance.In order to provide an even more successful method, predictive maintenance is utilizing new technology, such as the artificial intelligence. Among the most popular leading Predictive Maintenance Software include Presenso, GE Predix, and Siemens MindSphere. I personally don’t believe that installing sensors for a lightbulb in your desk lamp is an effective form of maintenance strategy, but of course, everything still relies on the exact timing of the nature of the environment or piece of equipment.
-
It is true that Metcalfe’s law is more tuned to the digital world such as bitcoins and cryptocurrency. But when it is applied to an organization, it can creates havoc to the smooth flow of the functional process. Essentially Metcalfe law state that In telecommunications and computer networks the idea of Metcalfe's Law is employed to illustrate a network's worth. According to Metcalfe's Law, the influence of a network is related to the square root of the network's total nodes. A network, for instance, has an inherent value of 100 (10 × 10) if it has 10 nodes. Computers, servers, or connecting users might be the end nodes. Over the lapse of time, Metcalfe law evolves into a more business oriented approach than the mere computer based aspects. Amazon might not be assigned the top auction website but it definitely have the most daily visiting users. In this sense, it becomes strategically hard to reproduce this interconnected networking as the networking force is so geared up which eventually force out competitors. A simple visual graph can be demonstrated overtime and the impact become apparent. The benefits of small-sized team are described below. Rapidity and Adaptability In huge organizations, it's common for employees to be unaware of the duties of their coworkers. The more people there are, the longer it takes to coordinate and handle tasks. Although there are more links, their quality is declining. People who are unaware of their surroundings may work on jobs that are uninteresting, useless, or redundant. The capacity to swiftly and effectively coordinate is a small team's key benefit. A team of five to ten persons can be connected considerably more easily. These groups react to changes swiftly. Knowing what their coworkers are doing and how the product is moving, employees jump right into duties. The information and knowledge sharing in this kind of team is open, and reliable support is developed. Human Relationship People can more easily become close in a contained environment and foster a caring environment. Smaller teams are more cohesive, more empathetic, and have stronger interpersonal relationships. In a bigger organization, employees can get lost. New hires take longer to adapt, interpersonal relationships deteriorate as the team grows, and team members stop being as encouraging of one another. Minor downsides Small teams lack the resources necessary to produce complex goods. They are compelled to use more power, be more inventive, and take on additional risks in attempt to compete with giant firms. A small team's flexibility may not always be a plus. Building rigorous processes and adhering to them for years is impossible due to the product's changing requirements, and minor issues can cause the product's development to stall. Therefore, it is crucial to have a head who can coordinate the operation and point everyone in the proper direction, even for a small group of two people. What size should a team therefore be? The CEO of Amazon, Jeff Bezos, famously said: "If two pizzas can't feed a team, then it has too many employees."
-
The Shainin X methodology is described as a system for resolving issues created for medium- to high-volume processes where data are easily accessible, statistical techniques are frequently employed, and process intervention is challenging. It has mostly been used in facilities for part and assembly processes. The basic principality of the Red X technique is that there is always a dominant cause of variation. This claim is supported by the Pareto principle's application to the causes of the variance. Usually, changes in a number of inputs lead to changes in the output. These inputs (Xs) are divided into groups based on color, with the Red X serving as the primary cause. The GreenY state is how Shainin describes the desirable state of the output. Using Shainin tools has the benefit of requiring very low sample sets for problem analysis. Frequently, samples of just two or three are sufficient to draw statistically significant results. The data can be analyzed without the use of computerized statistical methods. Moreover underlying causes are identified through "interacting to the parts" as opposed to assumptions or preconceived notions. Due to the statistically robustness of the procedures, main effects and interaction effects were distinguished and quantified. A great variety of versatility is offered by the 12 various approaches. It is simpler to incorporate the entire workforce because the strategies are simple to implement and inexpensive to learn. The below four groups can be used to group the 12 techniques: Generation Clue: Until the fundamental cause can be isolated, quasi causes of variation are removed using the multi-vari analysis filtering technique. Pictograph: Used to indicate where a flaw is located on a component, in a design, or on a grid. Either a random pattern or a concentration in a specific location will result (s). Components Search: To identify the source of the issue, parts and sub-assemblies are switched between good and problematic products. -Comparing the greatest and worst product examples side by side will help you identify the traits or factors that set the best and worst goods apart. List and quantify the process variables in the product/process search -Search for Products/Processes: The process variables that affect a product's quality should be listed and measured. By contrasting data from a process that yields good parts with measurements from a process that yields faulty parts, you can identify which of these process factors is to blame for the problem. DOE optimization By displaying one variable against the other, a scatterplot (also known as a scatter diagram) can be used to visually depict the relationship between two variables. RSM, or Response Surface Methodology When we want to improve the settings of the essential elements in a process once they have been isolated, we apply a DOE technique. When we are aware of or believe that the response variable has curvature (i.e., non-linearity), we use RSM designs. DOE approach Variables Search: A grid search approach that distinguishes between significant and minor process variables through testing the optimal and limiting values for each variable Complete factor analyses: These tests cover all possible combinations of variables, and all of their interconnections, and work best when there are just a few variables that have a big effect on the answer variable. They take longer and cost more to execute than screening methods. B vs. C: B stands for the superior or improved method, whilst C stands for the existing process. Six samples—three B samples and three C samples—are used in the test. According to the Law of Combinations, there is simply one possibility in 20 that all three Bs will outrank all three Cs, providing us 95% certainty that this is not a coincidence. Positrol (or precontrol): Items are rated as red, yellow, or green depending on how closely they adhere to the standard or tolerance. Green represents the tolerance's middle portion; yellow represents its second half; and red represents the tolerance's upper limit. How frequently the process requires change determines the sampling frequency. Continue running if a specimen is green. Choose another sample if the first one is yellow. Stop the process and tweak or modify it if the second piece is yellow. If any of the samples are red, halt the procedure and make any necessary adjustments. The Process Certification (Process Control, and Management Plan) specifies the who, how, where, and when of controls that will guarantee that the significant variables or factors are kept under control.
-
Cohen Kappa Is an inter observer correlation measurement for a single factor with more than one observer evaluation. It is used to provide the user with calculable benchmark of the degree of agreements vis-à-vis all observers. As such, it is used to know how recurrent there is agreement in the observer’s interpretation. In a normal scenario where a yes/no answer is involved, the outcome is weak as it does account for chance. This is why Kappa which take into consideration the removal of chance to be much more preferable as a measurable statistical tool. Results of Kappa can range from -1 to 1. A Kappa 0 indicates that the agreed results are equal while expecting a chance. When Kappa value is 1, the agreed results are perfect. When Kappa is less than zero, the agreed result are less weighted with respect to chance. A good Kappa result can range from 0.75 to 0.90. Fleiss Kappa is a mathematically derived statistic to know how reliable is an agreement in relation to constant number of observers. It is relevant when observers label a rating when the items are classified or to the amount of ratings. Fleiss Kappa is a Fleiss Kappa for greater than 2 people who rates the agreements. However compared to Cohen Kappa, Fleiss Kappa are random people who are selected for rating an agreement while in Cohen Kappa, those who rate are known and fixed. A researcher will obviously look for Cohen Kappa when the values classified are of nominal order that is there is the results as no, bad, false, true, good, yes, crispy or nor crispy etc. however for ordinal values, a researcher will take Kendall coefficient into account.
-
A limit is the optimal value which is allowed. In order to achieve a stable process and capability in six sigma, control limits and specifications limits are widely used. Control Limit(CL) and Specification Limit(SL) are mathematical restraints unlike sky is the limit which know no boundary. However, both have different applicabilities and vary completely in terms of concepts and statistical perception. Essentially, CL is the voiceprint of the process which act as an indicator to apply actions in a process. It is computed based on measured data population which is presented on Control Charts. Usually an X-bar chart is used for representation. Such values are then attributed to subgroups to reveal the performance of the controlled process. These limits are set at the center of +/-3(sigma) such that the center and the sigma are enumerated according to the selected control chart. It exist 2 types of CL being Upper Control Limit(UCL) and Lower Control Limit(LCL). In simple terms, UCL is obtained by adding the mean with 3 times the standard deviation(s.d): (Mean + (3*s.d)). On the other side, LCL is obtained by deducting the mean with 3 times the s.d: (Mean - (3*s.d)) An illustrated X-bar where the specifications fits into the control limits is shown below. SL is the voiceprint of the customer which acts as a law maker to produce what the process really have to materialized. It is designated by the customer with regards to the characteristics set out which is presented on Histograms. Probability and box plots are also used for representation. These values are attributed to items rather than subgroups in order to unfold the good items away from the bad one. The Upper Specification Limit(USL) and Lower Specification Limit(LSL) are the 2 types for SL. USL and LSL are used to gauge the level of customer demand. If the item fits the range of the limits, then the item is considered to align with the needs of the customer. Else, if the items is out of range, the item does not comply with what the customer expected. A vivid representation of SL using histogram is illustrated below. To have a clear picture of CL and SL, let’s take a look upon the relationship between these two. If the CL fits into the specifications, then it is indeed the top notch design for an organization process. This is so because any variation emanating from known source will fit into the specifications range. In such situation, even if the CL vary over a period of time, it will not sever alarming consequences to render the customer specifications as required. If the CL is equivalent to the SL, then all variations which are known from the process will definitely align with the specifications of the customer. The major stumbling block in this situation however will be to make the process undergo statistical control due to the appearance of any unknown variations will result into defects. If SL fits between CL, there will a portion of the process that will cause dysfunctional operability. When the CL surpass the SL, some process will be operating beyond the specifications quotas. In other words, having CL larger than SL will without a doubt lead to the creation of defects. If there exist no linkage between LSL and USL, it is clear enough to conclude that the whole process is unfeasible with regards to the specifications meaning that the process itself is defective. This can happen whenever the design of the process is by all means incapable to unite customer specifications. It can happen that the process is behaving correctly but the expectations from the customer is erroneous or the process has triggered highly deficient issues from the design being incapable to meet what the customer expected. A simplified scenario presented below to better understand how CL and SL is being applied winning a pizza competition. Panecuit is a known pizza maker in Paris who wants to compete for the international best pizza in Italy. He looks out for the best Chef in Italy to gave him a helping hand to compete against the other participants. The Chef gave him the records of the top performance statistics and provide him with valuable piece of information. The key to reach the pinnacle to win is to complete the pizza within the timeframe of 20 seconds(sec) to 25 seconds. It is within that range that the preceding competing participants won the competition. Without any further do, Panecuit get holds unto practicing and begin countdown his performance. Under his scrutinize monitoring of performance, his range of having a pizza into the oven is between 22sec to 30sec, considering that deviation of 3 sigma with respect to the mean performance. At that time, 20sec to 25sec was the objective to be achieved while 18sec to 26sec was the current performance. One important factor to be taken into observation. CL is primarily used to analyze variations arising out of performance. Even Panecuit’s performance ranges from 18sec to 26sec, it still pose a matter of concern for the competition. The other participant, Cuitlente, might present a steady performance which will make him stand out as a winner. He is performing with a countdown ranging from 20sec to 24sec having an identical mean of performance as Panecuit with 24sec. What is to be noted here, is that Cuitlente clearly shows to be more consistent and display few variations and thus preference will be given to Cuitlente rather than Panecuit. Let’s introduce Cuitvidé, with a consistent CL of 20sec to 22sec. Cuitvidé showing clear sign of constrict variations and more consistency within the timeframe, that is the specifications area. Hence, he will stood at a winning advantage as compared to the remaining.


-
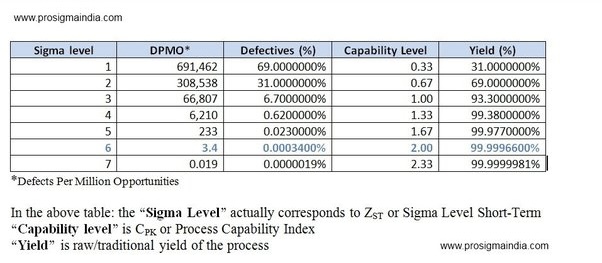
How to curb defects and boost daily production is the key to what six sigma offers by process improvements, delays elimination and fixing other aspects of a production process. Essentially, six sigma is a statistical management application used to produce processes having lowest defects. The mathematical formula to calculate the sigma level is as follows: “(Opportunities-Defects)/Opportunities x 10” Theoretically the output for six sigma level ranges from 1 to 6 as follows: The sigma term is used to denote the sigma level in any given part of a process and state the defects that occur at that particular sigma level for that process. Any process that operates at sigma level-6 is deem to be perfect with regard to statistics. As such, it has only 3.4 DPMO (Defects Per Million Opportunities) whereby it’s accuracy is at 99.99966% of operating capacity. A process is statistically differentiated at a sigma level-5 with a sigma level-6 in relation to the presence of number of defects involved. In a +/- sigma level-1.5, the data portion will be 0.4332. Note that as the level of 6 sigma falls, the defect value may either fall or increase as well. It is important to note that errors and expenses rises as the level of sigma falls. Under specific conditions the team lead for enhancing a process, may encounter a data distribution for defect which are positive and skewed, and as such he need to take corrective actions based on the defects involved. Subsequently, the baseline performance is an imperative factor to be used to be taken into account to be able to shift from defects to acting upon improvement. Based on the above illustrations the sigma level is derived based on the number of standard deviation that any process has in relation to the mean and customer specifications. Hence, in an attempt to have more standard deviation with the mean and customer specifications at intervals, there will be a minimizing amount of defects in the process and thus increasing level of sigma that will eventually benefit the customer to its expectations. The probability measurement of the area in the bell curve ranging from +1.0 to +2.0 will have a standard deviation to be 0.8185. When a process is 1-sigma, it is said that it is encountering more defects according to the customer specifications as compared to a six sigma operation. For a 1-sigma, there are around 690k dpmo while a mere 3.4dpmo for a 6-sigma which make it more efficient and productive to work at the latter. An organization adopting 6 sigma for enhancing its process is more likely to be chosen when dealing with complex issues arising from processes. The six sigma priority for any projects in an organization should be to prioritize the project which yield the most potential customer satisfaction. Given that the approach to six sigma is an entirely factual data driven methodology, it does have some limitations. The commonly used 6 sigma in reality actually refers to a 4.5 sigma level due to the introduction of a 1.5 sigma shift that is used to deal with long-run variations of a particular process. True six sigma will therefore allow a maximum of 2dpmo. For short-term calculations, true six sigma at 99.99966% is used while for long-term calculations the shifted 6 sigma is used at 99.9999998% is used. In the light of the above, a management organization that entirely integrate the 6-sigma disciplinary procedures constantly measures and indefinitely enhance its process in a continuous cycle.