Pushpa S. Bharadwaj
Members
-
Joined
-
Last visited
-
Pushpa S. Bharadwaj replied to Vishwadeep Khatri's topic in We ask and you answer! The best answer wins!First In First Out and Last In First Out commonly known as FIFO and LIFO are Inventory valuation methods. First In First Out (FIFO) is a technique whereby sale or issue of goods from store is made from the oldest stick in hand. Also, referred as First In. Last In First Out (LIFO) is the inventory valuation method basis the assumption that the last stock will be sold first. FIFO LIFO Key differences between LIFO and FIFO- FIFO has no restrictions against use by IFRS and GAAP while LIFO has restrictions against use by IFRS FIFO decreases the number of records to be maintained, while LIFO increased the number of records Advantages of FIFO and LIFO- FIFO is considered to be a lot more simplified system than LIFO. FIFO has ability to stabilize the cost of goods sold as the items in stick represent recent pricing. LIFO on the other hand, occurs in the scenario where deflation occurs in an economy whereby the value of the unsold items will increase and value of cost of goods sold will decrease resulting in high profits. Disadvantages of FIFO and LIFO- FIFO increases taxable income with inflation in the costs of inventory also making it difficult to account for costs in instances where inventory is exchanged or returned. The main disadvantage of LIFO is the restriction against its use by IFRS, the discrepancy caused between the cost basis on initial inventory and the recent market price and the difficulties caused when interpreting current inventory activities as well as operating activities in a company. In the nutshell, FIFO is generally preferred over LIFO system. Examples: FIFO: In January a small business purchased 100 quantities of item A for $25 each and 50 quantities of item B for $15 each piece. In March, it purchases 25 more quantities of item A for $30 each and 125 more of item B for $20 each. It sells 50 items of B and 25 items A during the first quarter of the year, i.e. 75 items in all. Using FIFO, the calculation of Cost of Goods Sold (based on plants purchased in Jan) will be- 50 item B x $15 ($750) + 25 item A x $25 ($625) = $1,375 LIFO: Using LIFO, the calculation of Cost of goods sold will be- 50 item B x $20 ($1000) + 25 item A x $30 ($750) = $1,750 Hence, in FIFO, Cost of inventory is lower resulting in higher profit and more taxable income whereas, in LIFO, cost of inventory is higher resulting in lower profit and less taxable income.

-
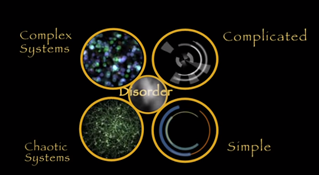
Pushpa S. Bharadwaj replied to Vishwadeep Khatri's topic in We ask and you answer! The best answer wins!Cynefin literally means 'habitat' or 'place'. It is pronounced as “ku-nev-in” (welsh word). It is used to describe the elements of our personal history or situation that influence our thoughts and decisions in ways that we don’t understand. Those elements are to like place of multiple belongings; cultural, religious, geographic, tribal etc. The Cynefin Framework is a sense making model and not a categorization model. Unlike categorization model, data precedes the framework in sense-making models. It is a problem-solving tool that puts situation in 5 domains shown below- Cynefin model helps assess situation more accurately and respond appropriately. Simple situation is also called as Obvious situation. In the above framework, Complicated and Simple are said to be ordered and Complex and Chaotic part us know as unordered. Examples of each domain: Simple/ Obvious-conducting stake holder interviews Complicated- Learning and development strategy for organization Complex- Implementing stake holder recommendations Chaotic- Budget reallocation, organization restructure Response: In obvious domain/ situation, one must Sense, Categorize and Respond. Categorize is the appropriate response. In complicated domain/ situation, one must Sense, Analyze and Respond. Analyze is the key action. In complex domain/ situation, one must Probe, Sense and Respond where, Probing is the key action to take and, In chaotic domain/ situation, one must Act, Sense and Respond. Acting becomes the key action in Chaotic situations. Disorder- “Disorder” situation is the most difficult one. It is difficult to determine which of the four domains is dominant. People generally tend to make decisions replying on decision making techniques that are known and comfortable. Goal in this situation is to gather more information and move to any of the 4 domains in order to act appropriately. In the nutshell, each of these domains has specific decision-making approach that helps to make better understanding of situation and to make sense out of it in order to choose most appropriate action and move forward.
-
Pushpa S. Bharadwaj replied to Vishwadeep Khatri's topic in We ask and you answer! The best answer wins!Supermarket in Lean manufacturing is one of the pull strategies in production. It is a system used when one-piece flow or FIFO are not an option. In simple words, it is a method of inventory management system. In this method, the internal customer will draw a random part from the supermarket after which the internal supplier will replenish the drawn parts at needed interval. This is known as replenishment pull system. The size of the supermarket is determined by the time which needs to be buffered. Now, how does the internal supplier know when to replenish and which part? There are two well-known methods- 1. Implementation of Kanban boards. 2. Two-bin system (in which bins themselves are used as signals) In Kanban board method, every position in supermarket is represented by a card on which all replenish information is printed. Kanban card is an authorization to produce. This method can be implemented in almost all situations. In Two-bin system, as name signifies, there will be 2 bins assigned which are filled with parts. This system is best suited for cheap parts which are needed in multiple workstations, example, bolts, pins as the impact on financial costs and the space. Supermarket is a very useful Visual management system. It helps to see which inventories are high, low. It can be implemented physically or digitally in ERP system.
-
Pushpa S. Bharadwaj replied to Vishwadeep Khatri's topic in We ask and you answer! The best answer wins!Lean Six Sigma Sponsor vs. Lean Six Sigma Champion Sponsor and Champion are key roles in any Lean Six Sigma organization for successful completion of the project. However, in some organizations and projects these roles are played by the same individual, yet delivering successful projects. It is good to have a Sponsor and a Champion, but not a must depending upon the size, impact of the project , type of organization structure and roles. Below is the common definition of these roles are some of the key roles and responsibilities of Champion and Sponsor. Lean Six Sigma Champion is the initiative leader in an organization. Sometimes, Champion is the CEO of the company or his/ her direct reports. Key responsibilities of Champion- -announcing and initiating Six sigma projects in the company; -sets and communicates the overall objectives of the Six Sigma program; -sets target for business units in terms of business measures like financial savings, customer defects etc.; -Provides resources for Six Sigma Training; -monitors progress with respect to plans and targets; -resolved issues in organization; -sets up steering committee structure involving functional heads Lean Six Sigma Sponsor is Sr. Business manger who owns the projects. He/she is the key stakeholder in the success if the project and are accountable for the outcome. Sponsors support belts in terms of making resources available to them, motivating and challenging them and the team members. Sponsors support also includes budgetary approvals, team member's time and availability, getting support from cross-departmental functions etc. Sponsors should also report progress and status of the projects they have sponsored in top management reviews. Apart from ones already mentioned, the Sponsors are also responsible for- -identifying project opportunities which are linked to Strategic goals and objectives; -conducting periodic project reviews to ensure that the belts get necessary support; -recognize and reward the belt and team members on successful project completion Example: There could be a flat organization in one of the functions where funding is done by Sr. Business manager who can also play role of both Champion and Sponsor.
-
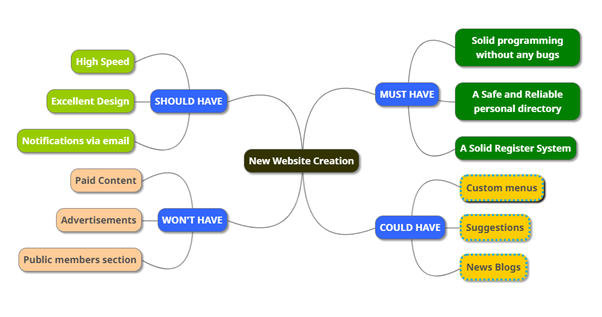
Pushpa S. Bharadwaj replied to Vishwadeep Khatri's topic in We ask and you answer! The best answer wins!MoSCoW method MoSCoW method is a prioritization method that was developed by Dai Clegg in 1994 for use in Rapid Application Development (RAD). It is also known as MoSCoW prioritization or MoSCoW analysis. The term Moscow itself is an acronym from the first letter of each of four prioritization categories: M - Must have S - Should have C - Could have W - Won't have The interstitial Os are added to make the word pronounceable. While the Os are usually in lower-case to indicate that they do not stand for anything, the all-capitals MOSCOW is also used. The Moscow method is a prioritization technique used in management, Project management, new software development, business analysis to align with stakeholders on the importance they place on the delivery of each requirement. MoSCoW Method is often used where a deadline is fixed so that the focus must be on the most important requirements, and as such is a technique commonly used in software development (agile) approaches such as Rapid Application Development (RAD). Scrum and Dynamic Systems Development Method (DSDM). Source: www.kecg.co MoSCow Method plotted on Kano Model of Customer Satisfaction MoSCoW Method Example: Project: Creation of a Professional website for a Law firm Purpose: People can register and track their court cases Below are some of the drawbacks or criticisms of MoSCoW Method: · Does not help to decide between multiple requirements within same priority bucket · Subjectivity on how to rank competing requirements: No explanation on why something is ‘must have’ rather than ‘should have’. · Ambiguity over timing, example- Won't have category: whether it is not in this release or won’t be considered for ever · Huge room for Bias- New features over technical improvements


-
Pushpa S. Bharadwaj replied to Vishwadeep Khatri's topic in We ask and you answer! The best answer wins!Cost-Benefit Analysis is commonly known as CBA. Alfred Marshall, British economist popularized CBA. It is one of the Key Financial Measures and a Management tool to determine if approval should be given for the project go-ahead. Project CBA is a comparison to determine if a project will be (or was) worthwhile. The analysis is normally performed prior to implementation of project plans and is based on time-weighted estimates of costs and predicted value of benefits. The actual data is analyzed from an accounting perspective after the project is completed to quantify the financial impact of the project. Sequence of performing Cost-Benefit analysis: 1. Identify the project benefits 2. Express the benefit in dollar amounts, timing and duration 3. Identify the project cost factors including materials, labor and resources 4. Estimate cost factors in terms of dollar amounts and expenditure period 5. Calculate the net project gain (loss) 6. Decide if the project should be implemented (prior to starting), or if the project was beneficial (after completion). If the project is not beneficial using this analysis, but it is management’s desire to implement the project, what changes the benefits and costs are possible to improve the cost-benefit calculations. This is “Exception to CBA”. Few examples of exception to CBA: 1. Projects undertaken and investments to satisfy regulatory requirement. 2. Risk Mitigation actions might not always yield +ve returns, but yet implemented Some of the Key associated tools are- Return on Assets (ROA) ROA= Net Income/ Total Assets Where net income for a project is the expected earnings and total assets is the value of assets applied to the project. Return on Investment (ROI) ROI- Net Income/ Investment Where net income for a project is the expected earnings and investment is the value of the investment in the project There are several methods used to evaluate project based on the $ or cash amounts and time periods. Three common methods are- · Net Present Value (NPV) Method · Internal Rate of Return (IRR) Method · Pay Back Period Method
-
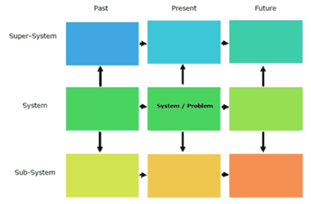
Pushpa S. Bharadwaj replied to Vishwadeep Khatri's topic in We ask and you answer! The best answer wins!9 windows is one the idea generation tools. It helps exploring issues and impact of the issue by considering past , present and future. 9 windows technique helps organizations to change and evolve without relying on past ways of working which might now work in present world/ situation. It primarily helps to break the psychological inertia. It ensure individuals and companies are constantly innovating or developing new ideas, methods and systems , products and services. It makes one think creatively taking into consideration Space and time. How to use 9 windows: 1. Write problem and current system for solutions in center of a 3 by 3 matrix 2. Explore the problem in 3 different levels stated below- External environment and components that the problem or system interacts or may interact with- Super-system (or Macro system) The problem or system that was created- System A component or parts of the problem or system- Subsystem (or Micro system) 3. To complete System row: a. list what started the problem in the Past/System cell b. list the goal—where the project will ideally end up after the solution—in the Future/System cell 4. To complete the Super-system row: a. list everything one would do to prevent the current problem (in the environment that the system functions) in the Past/Super-system cell. b. list everything one can do to fix the problem going forward in Future/Super-system cell. 5. Once the present system is explored, team moves to Past by listing everything once could do in the past and to prevent the problem in the past/ subsystem cell. 6. Then, list everything once can do in the future (if the problem still exists). 7. 9 windows are explored by asking- Can company do anything in these 3 levels proactively/ in advance to avoid the problem or improve the system? Can company do anything in these 3 levels in future to avoid the problem or improve the system? Can company do anything in these 3 levels in present to avoid the problem or improve the system? 9 windows is often used in TRIZ (theory of Inventive Problem Solving) Problem solving analysis and forecasting tool. 9 windows technique example: Scenario : We want to cultivate dragon fruit (Pitaya plant) in colder climate while it is generally grown in semi dry environment. 9 windows would look like below-

-
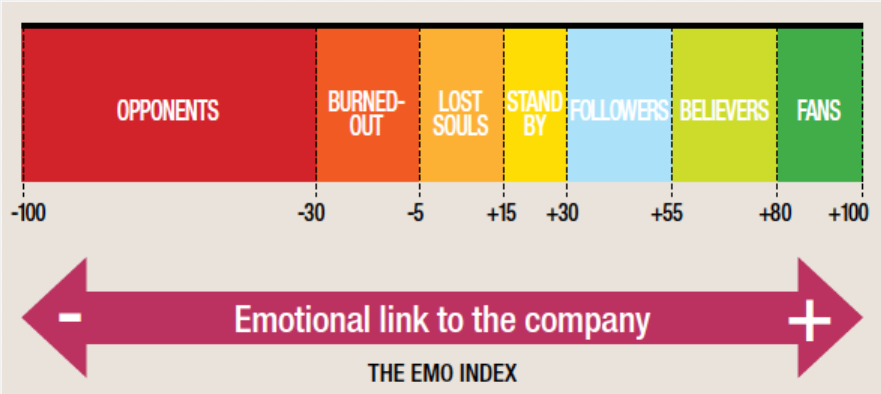
Pushpa S. Bharadwaj replied to Vishwadeep Khatri's topic in We ask and you answer! The best answer wins!EMO index is a customer satisfaction measurement tool which helps to measure the feelings of a customer or a group of customers/ stakeholders towards a company, its products or services. It is used as an alternative to traditional ways of measuring Customer Satisfaction where the customer behavior was predicted primarily on the basis of socio- demographic variables like- sex, age, class) or specific parameters basis historical purchases. The index is measures by combining Net Emotional State (i.e. balance of emotions felt) and the Net Intensity Balance (i.e. intensity with which they are felt) in a scale of -100% to 100%. EMO Index classifies customers into seven EMO Clusters: Ø Fans (+100 to +80) Ø Believers (+80 to +55) Ø Followers (+55 to +30) Ø Stand By (+30 to +15) Ø Lost Souls (+15 to -5) Ø Burned Out (-5 to -30) Ø Opponents (-100 to -30) Its creators believe that EMO Index is more reliable indicator than traditional tools like Net Promoter Score.
-
Pushpa S. Bharadwaj replied to Vishwadeep Khatri's topic in We ask and you answer! The best answer wins!Decisional Balance Sheet is also called as Decision Balance Sheet (DBS). It is a simple but effective decision-making method that enables a team to make balanced and confident decisions. It is a tabular record to represent the advantages (Pros) and disadvantages (Cons) of an idea or a situation for the purpose of reaching to a decision quickly. It aides the user when there are multiple choices, to avoid making wrong choices. Key advantages of using DBS are- · Avoid decision-making paralysis · Enhances understanding of idea or situation better · Speeding decision making process DBS is widely used in the team environment to quickly reach to consensus. However, this needs good amount of preparation and should also be chosen to be used in conjunction with other decision-making techniques that could be more appropriate. DBS is a 2*2 table to record Pros and Cons in short-term and Long-term. Scoring system (PMI) is used to decide whether to go ahead with idea/ decision or not. PMI simply stands for Plus (+), Minus (-) and Interesting (I). Interesting is used when elements of idea are not particularly + or – effect. Steps in using Decision Balance Sheet: 1. write the situation or idea at the top of a flip chart or whiteboard. 2. Draw 2*2 table to capture short-term and long-term, Pros and Cons 3. Record all benefits in Pros and possible negative effects in Cons 4. Give numerical weights to recorded points on both side (try to be objective) 5. Add scores in Pros and Cons and subtract total cons from pros total 6. Consider final score and decide to go ahead with the decision or not Example: Decision to join BE- MBB Course- Plus (+) Minus (-) Short Term Best use of weekends (4) Gain new knowledge (4) Virtual session (3) Corporate sponsorship (4) Weekend login (-3) Long Term Enhancing skill set (4) Get higher salary (4) Professional Network (2) Opportunities to implement skill (-2) Cost of software (add-on- crystal ball) (-4) (+27) (-9) (+18)
-
Pushpa S. Bharadwaj replied to Vishwadeep Khatri's topic in We ask and you answer! The best answer wins!Origin: Startup investor Sean Ellis coined the term “North Star metric”. Sean intended it to reduce administration, simplify meetings, and align teams around the singular goal of growth. The term North Star metric is drawn from the common name for Polaris, the star that lies directly above the Earth’s Northern pole. It is mostly rhetorical. Meaning: A North Star metric is the one measurement that’s most predictive of a company’s long-term success. To qualify as a "North Star," a metric must reflect three factors tailored to each business- Lead to revenue, Reflect customer value, and Measure progress. If a metric hits above three points, and every department contributes to improving it, the company will grow sustainably. Companies should feel equally free to reevaluate their North Star metrics to make sure they still point the right direction, and amend them when they prove flawed (Real life example is what LinkedIn did- LinkedIn’s initial NSM was the number of endorsements given because it was a relationship-building factor between the users. But endorsements were found to be falsified and they changed their NSM to monthly active users (MAU). North Star metric is intended as a long-term guide and not to be confused with One Metric That Matter (OMTM). Identification and requirement to measure North Star Metric: A North Star metric must reflect all three factors, tailored to each business. To find North Star metric, companies need to - Ask, what is essential to the business’ functioning? Prioritize the list. Ask, what Key performance indicators and metrics measure the top few, key factors? Ask, what metric encapsulates all of the above? Keep the North Star metric on top of the pyramid (in metric hierarchy) Companies that select a North Star need the culture that is flexible and right infrastructure. Most teams find user analytics vital to measuring their North Star metric. Generating Long Term Customer Value: The North Star Metric is the single metric that best captures the core value that products delivers to Customers. It helps generate value to Customers by- Being close to the customer’s success moments: A good North Star Metric is always close to the moment when the customer gets the intended result from the product. Example, For Airbnb, the North Star Metric is the number of nights booked, close to the ease of trip booking or booking facility in general (customer’s intended result moment). Adding value to customers: The North Star Metric should not be just for the company profit; it should add value to the customers. Example, if the North Star Metric is the number of orders made, it means you are not focusing on the quality of service. Hence, the number of orders delivered without complaints would be a better North Star Metric than just the number of orders made. The satisfied customers will always refer your product or service to their friends resulting in the company’s long-term growth. Measurable: Continuing with the above example, companies cannot measure ‘satisfaction’ in general. Thus, companies will have to figure out a way to measure quality. Reduced number of complaints against X orders or the number of orders delivered before the anticipated time can be considered measurable North Star Metric. Time-bound: North Star Metric should be measurable based on a certain period, which can be an hour, day, week, or month to help you in clearly seeing the growth over time. Example, the number of orders delivered without customer dis-satisfaction in a week metric helps compare against the previous weeks’ data. Without the week parameter, the comparison factor would be missing from the above North Star Metric. Companies should never take the year as a period because you should see growth data regularly. Ideally, your NSM should grow every day or week. Not influenced by external factors (except Customers): North Star Metric should only be influenced by customers and no other external factors. Example, in the tourism industry, the weather, flight delays, or the local people act as external factors. Thus, the number of 5-star ratings per month is not a good North Star Metric for the tourism industry. Reflect your growth: North Star Metric should be directly proportional to your business growth i.e. if the Metric is increasing (positive), business should grow too, there cannot be an excuse for that. Example, suppose the product or service is related to the reports generation and download. In this case, the North Star Metric should be the number of reports downloaded by unique customers instead of the total downloads. Because the total number of downloads can also include scenarios where the customers generated and downloaded the reports multiple times (reason being that the service did not work as expected for the first time). Few other examples of North Star Metrics generating Customer value- Quora north star metric is the number of questions answered, which is aligned with their mission of being a knowledge-sharing platform. Spotify’s NSM is the time spent listening on the platform. This NSM measures the value that customers get from the platform In the nutshell, North Star Metric gives businesses a singular focus on a single objective. Instead of being distracted by everyday matters or individual tasks, everyone can always evaluate success by whether or not they are advancing the organisation using this metric.