

Archana Handa
Members
-
Joined
-
Last visited
Everything posted by Archana Handa
-
Sponsor is usually a high-level or from senior leadership who sponsors the Six Sigma program. They are responsible for setting up a vision for Six Sigma implementation, articulating the problem statement, defining the team’s objectives and validating the business case in the project charter. Looked up to for decisions at critical times at the project. A champion takes responsibility for driving Six Sigma implementation across the organization in an integrated manner. Is often a middle or senior executive who sponsor and promote continuous improvement initiatives through out their organization. Promote training and act as mentor for Black Belt candidates and makes sure that resources are available for projects. Actively involved and resolves any cross-functional team issues that may occur. Role of Sponsor & Champion in a Six Sigma project is summarized in the below figure : Role of Sponsors & Champions in six sigma program: In some organizations, Sponsors and champions are different with clearly defined roles. Where, Sponsors are Executive leaders, who set the overall organizational direction and set business priorities where Champions typically are top-level managers, who allocate project resources & promote process improvements. On the contrary, in many organizations, one role spills over another. Hence, the single top executive takes both the roles who oversees a Six Sigma project and is accountable to the Top Executives for the success of that project. However, considering the very thin line between these two roles, at times, organization create one role with combined responsibilities outlining the following key expectations: Participation in creating awareness & concept overview. Ensure employees participation in relevant Six Sigma training. Define Project Scope Provide necessary resources in Six Sigma projects. Ensure complete support for six sigma team to meet project objectives. Lay out clear expectations for the project results & quality. Make sure that project goals are not sub-optimized. Take decision based on facts by encourage bringing results based on facts and data. Engage themselves with project teams on regular basis to support them in problem-solving, decision making, and allocating resources. Change management and managing the negative attitude

-
CLV is a measurement of how valuable a customer is to your business with an unlimited time span across the whole relationship as opposed to just the first purchase. It is a very important metric while making important decisions regarding sales, marketing, product development, and customer support. This metric helps one to identify and understand a reasonable cost per acquisition and underline the importance to retain the existing customers than finding new ones, keeping your CLV high can be essential to your business’s success and will result in more loyal customers. Therefore, understanding CLV enables businesses develop appropriate strategies to acquire new customers and retain existing ones, while maintaining profit margins. Formula for measuring CLV is Customer revenue - the costs of acquiring and serving the customer = CLV. Let us take an example with the following assumptions : Profit generated by the customer each year = INR 1,0000 Total number of years that they are associated with the brand as customer = 5 years Cost spent to acquire the customer = INR 2,0000 The customer lifetime value of this customer would come out to be: INR 1,0000 (annual profit from the customer) X 5 (number of years that they are a customer) - INR 2,0000 (acquisition cost) = INR 3,0000 = CLV. That is, $1,0000 X 5 – $2,0000 = $3,0000 CLV can be measured through the following ways: By Identifying the touchpoints where the customer creates the value By Integrating records to create the customer journey By measuring revenue at each touchpoint Sum together over the lifetime of that customer
-
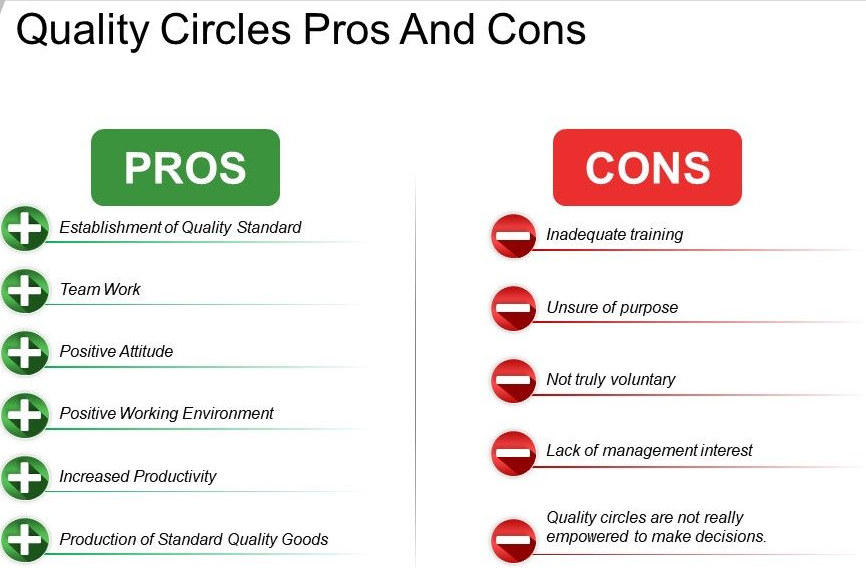
A quality circle or quality control circle is a group of workers who doing similar work, voluntarily meet together on a regular basis to identify improvements in their respective work areas using proven techniques for analyzing and solving work related problems for achieving and sustaining excellence leading to mutual upliftment of employees as well as the organization Quality Circles Characteristics : It is a method of continuous quality improvement by direct involvement of employees in quality Operate on the basic principle to drive employee participation in decision making and problem solving improves the quality of work Voluntary group of persons and the group consists of three to twelve members in number. Meet on regular basis and work on similar tasks Share area of responsibility and solve problems related to work History : Quality Circles have been around for approx. 60 years. It was suggested by W. Edwards Deming in Japan during the 1950’s, which became active in the early 1960’s in Japan. In 1960, Kaoru Ishikawa and the Union of Japanese Scientists and Engineers introduced the Quality Circle concept and flourished in Japan By 1974, it was picked up by the United States when Lockheed introduced Quality Circles In India Quality Circles is promoted by QCFI - Quality Circle Forum of India and was introduced initially into the healthcare arena. Quality Circle Tools Ishikawa Diagram displays hierarchies of causes contributing to a problem The Pareto Principle or the 80/20 rule, analyses different causes by frequency to illustrate the vital cause PDCA or Deming wheel describes as Plan, Do, Check, Act, as described by W. Edwards Deming PDCAW. Relevance of quality circles where there is scope for group based solution for work related problems Manufacturing firms Factories Firms Schools Hospitals Universities & Banks

-
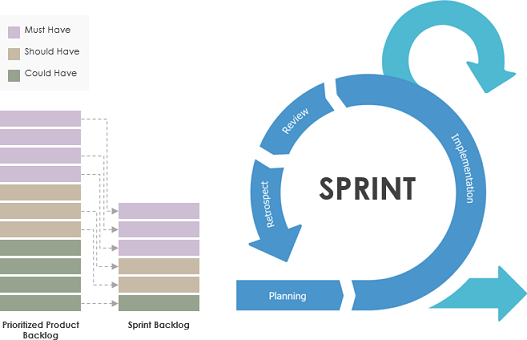
The MoSCoW method also known as MoSCoW prioritization or MoSCoW analysi is a prioritization technique to reach a common understanding with stakeholders on the importance they place on the delivery of each requirement. On most projects, we talk about requirements or features that are either in scope or out of scope. But to effectively manage those requirements, we also need to prioritize them and this is where the MoSCoW technique comes in. It classifies the importance of the different characteristics of a product in 4 Categories. M, S, C, and W: M is a must have requirement. Something that is essential and critical to the project and is not negotiable. S is a should have requirement. Something we need in the project if at all or wherever possible. C stands for could have. Something that is nice to have in case we have extra resources like time and budget W is a will not have requirement. Something that is out of scope for at least this time around The Business Analysist can make use of any prioritization techniques to prioritize the requirements thoroughly. However, MoSCoW technique is an effective one to use among all the other prioritization techniques that are available. Some of the key benefits of using MoSCoW technique are listed below : Defines the project scope Saves time Plans the project deliverables Prioritizes the requirement Manages resources and requirements Illustration 1 :Take a human body as an hypothetic example. We will plot the 4 prioritization categories: Must– a heart in the human body is “must”. Without it, there is no live organism. Should– a hand in human body is “should”. Without it is difficult. But one can survive even without hand. Well, if not in all, in most cases. Could– hair in human body is “could”. It is okay to have them, you even look nicer, but in its absence, one can definitely survive Won’t – unnecessary or not relevant in human body like waste. Probably, it might be an appendix Illustration 2: MoSCoW example on a sprint project : Prioritizing Product Backlog The Product Owner (PO) is responsible for getting the Product Backlog ready and prioritizing the items in the Product Backlog. Prioritization is vital in any form of development work because choosing the right thing to do allows you to maximize the value delivered in a Sprint. The Product Backlog items should be ordered and sequenced in a manner that the requirements with maximum business value would be completed first and empowers a team to move in a uniform direction towards a common goal. When doing the prioritization of your product backlog items at the Sprint planning session, here is a list criteria to be considered for your decision making: High customer value High benefit to the business Easy to be implemented High risk High cost if that is not implemented as soon as possible Dependencies between items Contribute most to the next Sprint goal? Inference: MoSCoW technique not just helps to prioritize the requirements at a high level, but also helps in specifying the detailed requirements, or features, of a product which enables you to delegate tasks better to team members and to set the expectations.
-
Q x A = E - Change effectiveness equation GE established their Change Acceleration Process thirty years back . One component of that process was the Change Effectiveness Equation denoted as Q x A = E. This equation implies the Effectiveness (E) of a change is equal to the product of the Quality (Q) of the change and the Acceptance (A) of that corresponding change. In simpler words : Q here denotes Quality or technical strategy of an organization for a change initiative. In the context of Six Sigma this will imply $$ , resources, tools/techniques, software e.g. Minitab, hardware like computers etc. A here imply Acceptance or also called Cultural or soft strategy. This includes resources skills like interpersonal skills or team management skills or facilitation skills etc. E here means Effectiveness of deployment of a change initiative To sum it all, it means that effectiveness (E) of all change initiatives (including six sigma) at an organization is a multiplication effect to the technical (Q) and cultural (A) strategy. Let us take an example: Say an organization is seeking to implement a new way of assessing and rewarding its staff. A lot of time has spent in putting together a suitable scheme. The scheme is not perfect but it gets a reasonable Q score of 7 out of 10. Constraints : However, the organization does not consider how it will gain acceptance for the new scheme, it fails to provide strong leadership and the need for change is never properly communicated. Hence, scores achieved can only be 2 for the A side of the equation and the culture does not change. As a result the new reward scheme is never properly implemented, and soon the organization reverts to the old way of doing things. According to our Change Effectiveness Formula, we would expect to see a change that was only 14% effective (7 out of 10 multiplied by 2 out of 10), or, a pretty ineffective change. Addressing limitations/constraints: To manage change effectively, it requires an understanding of both Q and A sides of the equation. There are number of approaches that can be used that consider the A side, ensuring that stakeholders and organization culture are considered in the improvement program thereby, yielding the highest possible effectiveness and impact for the change, meaning performance improvement that can be maintained. When working in the process improvement space, practitioners and organization get too focused on the quality of a solution (Q). We use all the right tools, identifies the root causes, and map out the future state beautifully. We pilot and prove the results with the hypothesis testing, new systems put up in place, and we get ready to move into production. But equally as often, these different solutions are not as effective as they could or should be because we ignored the other half of the equation which is - acceptance of the change (A) by the people or resources doing the work in the new processes and systems. Attaining a high E can bring the difference between success or failure. Most discussion or efforts center on quality. While as important as quality is, equal attention or effort should be on the acceptance of an idea or presentation? Often, it just makes sense to ask a few team members "how do you think this idea is going to land?" and then make changes accordingly. E = Q x A is a very simple equation, though there is nothing simplistic about it. In fact, if you run the numbers, you would be surprised to see to what happens to be true of any multiplication equation. An increase in the smaller of the two variables results in a greater product than increasing the larger one. Take an example, where Q=7 and A=3, it would give you an overall effectiveness of 21. Most left-brained practitioners tend to continuously improve quality, and pay little attention to acceptance. When you improve the quality of an idea while keeping acceptance low, than improving acceptance while leaving quality alone which implies from 30 to 42, there is a significant improvement by 40%. Accelerating A with Q constant: one could also invest time and effort to raise acceptance from the initial 7 X 3 = 21 to a 7 X 10 of 70 which lands a whopping 233% improvement. The key call out as a leader is that you should ask yourself if you have succeeded in creating widespread acceptance. It is difficult than most people think. What is required is selling the idea to a few key stakeholders, seeking their input, onboard them and make needed adjustments as required to earn their acceptance. The elements in the Change Effectiveness Formula to maximize the effectiveness are: Understand the formula Q x A = E Define the stakeholders (stakeholder matrix) Understand that resistance to change is natural Identifying four types of types of resistance when considering the Six Sigma formula for success: Technical, Political, Cultural and Individual Understand the stakeholder analysis chart/graph Understand threat opportunity matrix along with modifications of systems and structures People Element of Problem-Solving and how people & Solutions Work Together for Process Improvement Conclusion: For any organization to be successful in true sense with any meaningful process improvement initiatives, one cannot only focus on the “Q” part of the equation. Focus, structured, well thought planning to address “A,” the acceptance of a solution, alongside the “Q,” the quality of a solution is the only way to maximize the overall effectiveness of the solution. To quote and modify a well-known saying, “if you are failing to plan for change acceptance, then you are planning to fail.”
-
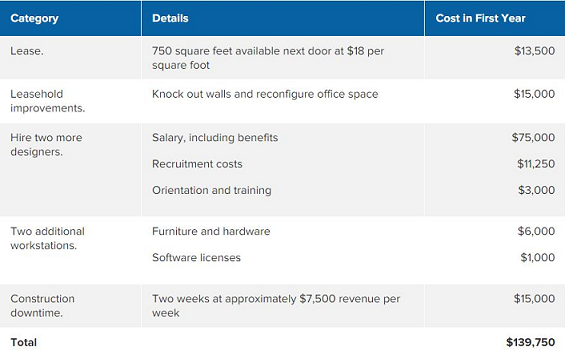
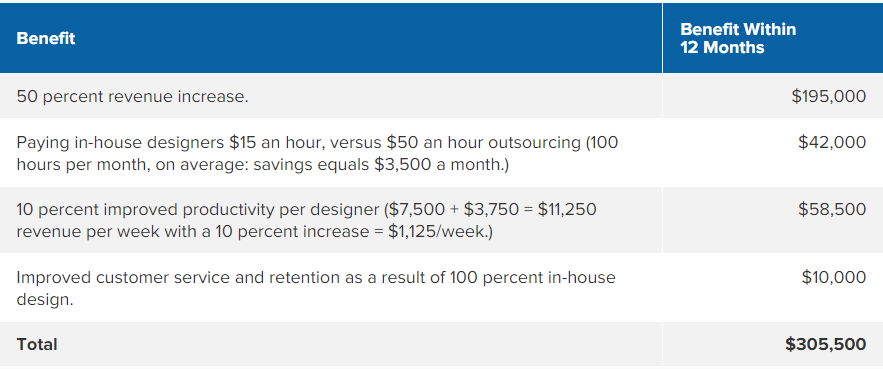
Cost Benefit Analysis is a powerful financial management and decision making tool. It provides a systematic approach to measure the benefits of a decision or taking action minus the costs associated with taking that action. Applications of Cost Benefit Analysis : It involves measurable financial metrics like revenue earned, costs saved etc. as a result of the decision to pursue a project. This monetary evaluation method helps to identify effective and favorable options and helps to take informed decisions. This technique also values intangible aspects in benefits and costs or effects from a decision such as employee satisfaction and customer experience. The results of the analysis are often expressed as a payback period which means that this is the time it takes for benefits to repay costs. Mostly, people who use it look for payback in less than a specific period for example three years. This technique can be used in a wide variety of situations like hiring decisions, evaluating a new project or initiative, or ascertaining the feasibility of a capital purchase. Tools or methods used in Cost Benefit Analysis : When carrying out the analysis, there are two main methods to arrive at the overall results. These are Net Present Value Model (NPV) : The NPV of a project refers to the delta between the present value of the benefits and the present value of its costs. If we observe NPV > 0, then it follows that the project has economic justification to proceed ahead. Benefit Cost Ratio: Benefit-Cost provides value by calculating the ratio of the total of the present value of the benefits associated with a project against the total of the present value of the costs related with a project. Higher the value above 1, higher are the benefits associated with the alternative considered. When using the Benefit-Cost Ratio, the analyst has to select the project with the greatest Benefit-Cost Ratio. Other tools & methods that can be used are regression modeling, valuation and forecasting techniques. There is a possibility to increase the reliability of the assumptions in a cost-benefit analysis by incorporating a sensitivity analysis and adding the discount rate. Let us take an example of the cost-benefit analysis suggesting a comparison between the two choices: Illustration 1 - Dynamic Graphic Works has been operating for just over a year, and sales are exceeding targets. Presently, 2 designers are working full time, and the owner is evaluating increasing capacity to meet demand. This would involve leasing more space along with hiring two additional new designers. The owner decides to complete a Cost-Benefit Analysis to explore the choices. Key Considerations : 1. Presently, the owner of the company has more work than he can cope with, and he is outsourcing to other design firms at a cost of $50/hour. The company outsources 100 hours of work on an average basis each month. 2. He anticipates that revenue will grow by 50% with increased capacity. 3. Per person production will grow by 10% with more working space. 4. The analysis horizon is one year: that is, he expects benefits to accrue within the year. Cost : Benefits : Lets calculate the payback time as given below: $139,750 / $305,500 = 0.46 of a year, or approx. 5.5 months Undoubtedly, the estimates of the benefit are subjective and there is a degree of uncertainty involved with the expected revenue increase. Regardless of this, the owner of Custom Graphic Works decides to go ahead with the expansion and hiring, given the extent to which the benefits outweigh the costs within the first year.
-
The Nine windows is a method used for identifying issues and their potential impacts by examining the past, present, and future of both high-level areas and its related subsections. In other words, Nine windows enables examine the innovation opportunity through nine different lenses across the dimensions of time and scale. Lets take the below example : Suppose you are crafting metal utensils that can be used on an airplane—but only for eating and not as a weapon. Instead of innovating the utensils themselves, one could focus their efforts on the raw materials that make up the utensils (subsystem), or even on the surrounding environment (super system). Nine windows is a grid which comprises of nine boxes and windows. Filling in the boxes provides eight additional perspectives on the problem one have identified and helps one decide how and at what level to apply innovation. Nine window example : Lets illustrate the use of nine windows by taking an example of planning for safety improvement: Firstly, Write the problem and the current system for solutions in the center of a 3 x 3 matrix, as shown in the Figure below. Secondly explore the potential problem/s at each of the following three levels: 1. Super system or also known as a Macro system: This includes external environment and components that the problem or system interacts or may interact with 2. System: The problem or system that was created 3. Subsystem or also called as Micro system: A component or parts of the problem or system The past, present and the future are planning goals. Review each window on timescales best suited for achieving future solutions and most favorable outcomes to make sure that the system, super-system, and subsystem will develop to achieve the expected outcome. The above example using multiple timelines, but companies and teams can choose the timeline they want, selecting a specific date or leaving the dates open in the past and future. Once the nine windows plan is created, the team can then plan and find solutions to improve or enhance safety performance. For example, the team should consider how to foster a culture where safety is a priority in action and language so that employees know that it is a fundamental component of their work. One of the likelihood is to create systems and real-time procedures to catch safety problems before they occur on the plant floor or at the work place. Another idea could be to formulate training so that management incorporates safety in the evaluation of effectiveness and to establish the proper metrics for positive recognition for stopping unsafe production activities. If safety problems persist, the team can start to implement future solutions within the subsystem, system, or at the super-system level to change or influence how the past, present, and future processes are utilized. As such, it is imperative to leverage nine windows early in your project to better scope the innovation opportunity.
-
What is EMO Index ? EMO Index is a framework which helps to quantify the client feelings, a gathering of clients or partners towards an organization, item or administration. It fills in as an option in contrast to conventional consumer loyalty research. EMO Index is an measure which calculated the emotional state of customers and stakeholders and is a registered trademark of EMO Insights International. In 2012 the EMO Insights International introduced the indicator in the study Emotional Management in the Spanish Retail Banking Market. The study was done based on close to 2000 interviews with retail banking customers, across all demographics. The study used neuro-science approach to analyze the customers' past and current experiences with the banks, and at the same time, the emotions these experiences generated in order to calculate their impact on the customers' behavior. How EMO Index works? EMO Index is an indicator which determines the general feelings of customer/s, group of customers or stakeholder/s towards a company, product or service. It is a combination of the Net Emotional State or balance of emotions felt and the Net Intensity Balance or intensity with which they are felt and, therefore, can measure values from -100% to +100%. Since EMO index is calculated at an individual level, it can also group customers into seven broad, general emotional categories which its creators call EMO Clusters: • Fans • Believers • Followers • Stand By • Lost Souls • Burned Out • Opponents EMO emotional segmentation model challenges the traditional models used for predicting behavior based on various sociodemographic variables like sex, age, social class, etc. or based on the classification parameters that are linked to a specific sector such as product purchased, volume of purchases, reasons for purchase, etc. While creators argue that the EMO Index is a more reliable indicator than the likelihood to recommend used by other tools such as the Net Promoter Score, However, their point is supported by another study on emotions in banking conducted one year later on 500 subjects who had participated in the earlier study. The purpose of the second study was to determine whether they had recommended the bank to their associates and the following results were observed: The grouping proposed by Reicheld in his Net Promoter Score -Promoters, Passives and Detractors is not entirely consistent with regards to what the customers usually feel or what they say they will act, at least in the Spanish banking sector. In specific, it is worth knowing that the term "Detractors" includes 62.6% of the customers and, therefore, it does not differentiate between the majority. In addition, it does not seem to correspond to the emotional state and the stated behavior of these customers or, at least not all of them
-
What is Leverage Point? Leverage points are those observations and data points, which are made at extreme or outlying values of the independent or x variables such that the lack of surrounding observations means that the fitted regression model will pass closer to the particular data point. Suppose there is a regression line fitted around a given dataset. Assuming there is an extra data point, an outlier which is far away from the main cluster of the data, but one which lies somewhere along that regression line, when extended. In case the regression line is to be refitted, the coefficients won’t change. On the other hand, removing the extra-outlier would have NO influence on the coefficients. Therefore, the outlier or leverage point would have zero influence if it were perfectly consistent with the rest of the data and the model. Example: It's easy to demonstrate that a high leverage point may not be influential in the case of a simple linear model. Refer to the model below: The blue-line is a regression line on the basis of the original dataset, the red-line ignores the point at the top right of the plot. This point matches the definition given for a high leverage point as it is far away from the rest of the data. Therefore, the regression line has to pass close to that point. But since its position largely fits the pattern observed in the original dataset, the other model would predict it very well and it is therefore not particularly influential. Compare this description to the scatterplot given below: Here, the point on the right of the plot is still a high leverage point but this time it does not really fit the pattern observed in the original dataset. The blue-line is very close but the red-line is not. Including or excluding this one additional data point completely changes the parameter estimates: Hence, it has a lot of influence on the final regression line. In this final example, the observation on the bottom right has a (relatively) larger influence on the fit of model but it still is far away from the regression line.
-
A North Star Metric is the one that best exhibits your company's objective. The correct North Star Metric can ensure supportable long haul development. It implies that the NSM is a key achievement indicator of your company's success. The NSM ought to infer three significant outcomes: - pace of get back to demonstrate how much an organization will grow in terms of revenue and customer base; - demonstrate ability to generate customer value; - quantifiability of all performance outcomes. If you develop the correct North Star metric, you'll lead to increased revenue for your organization. You'll see your product or service's worth valued by clients and steer your effort into right direction. With this metric, your organization will understand what enhancements should be carried out and what they will mean for future development. What is the need of such a metric in business environment? The North Star metric: - helps teams identify what should be done to improve the NSM performance, and prioritize / de-prioritize effort investment accordingly; - helps see the organization improvement digitized and speed up new product or service developments; - allows you to see the specific results of the work done. Can a North Star Metric change with time? The answer is both Yes and No. The NSM can surely evolve over a longer period of time. However, if NSM goes through too many changes in a short period, it simply indicates two possibilities: (a) Either the NSM is not correctly defined; or (b) Organization's vision and objectives are not clear How to identify right North Star Metric? Before we plunge into searching for the North Star, we should put any misinformation to rest. Key things to do for defining right NSM are: - Define what's key in your business, what is the genuine client esteem, what creates income and decides your advancement to track down your North Star. - Focusing on one major target you foster a reasonable system to see unmistakably where you ought to go. Developing KPIs to measure NSM correctly At the point when you know your North Star Metric, different performance numbers will help you develop NSM. Key Performance Indicators (KPIs) at that point become possibly the most important factor. These noteworthy metrics are numbers that assist you with addressing the inquiries concerning the eventual fate of your business. They have a few prerequisites: KPIs ought to be explicit, quantifiable, practical, significant, and time-bound. So, North Star Metric can clearly serve as a measure of company's ability to deliver on the objectives defined in-line with their vision and mission to deliver customer value. A clearly defined NSM not just help align entire organization to a common goal, but helps in growing customer experience and organization as a whole.