

EKA PILLAI
Members
-
Joined
-
Last visited
Everything posted by EKA PILLAI
-
Customer Lifetime Value is one of the very crucial metrics in Marketing and Sales which is used heavily to arrive at AD budgets , Branding exercises etc We can arrive at CLV with following elements Let’s assume the following: · Profit created by the customer at the end of Financial year = Rs 25,000 · Number of years the customer has been in the system – 4 · Cost to acquire the customer = Rs 10,000 The customer lifetime value of this customer would be: Annual profit earned from the customer ie Rs 25000 X No of years customer being retained ie 4 years less Customer acquisition cost in terms of Ads and marketing expenses ie Rs 10000 retention value 25000 x 4 = 1,00,000 – 10,000 = 90,000 is the CLV
-
Its called Quality circle or Quality of Circle and its simply a participation management technique to manage and enhance the Quality of the entire organisation The best part of Quality Circle concept is that it induces mutual trust between managers and employees which leads to bilateral contribution leading to achieving goals with mutual understanding The significant objective of forming a Quality Circle is to create a bond of good relationship with employees, and with that the employees will exhibit more interest and dedication towards which leads to enhancement in quality , productivity and cost reduction their work devotion As first instance Quality circles was conceived by Mr Kaoru Ishikawa and he used the terms Quality of circle in 1985 Even psychological surveys express and endorse that Employees exhibit more loyalty and devotion to their organisation if they are allowed to participate openly and engage themselves with others to define and solve the problems related to quality and or performance related objectives Generally it’s a group of 3 to 10 people and the most interesting part is that the employees voluntarily participate in Quality Circle and meet regularly to discuss the issues and resolve and its important that the participants are moderated and to make sure that they have the correct Quality circles offer employees the opportunity to use all their experience, knowledge and creativity to bring improvement into their activities. By deploying this concept employees are able to convert their long standing challenging problems into great opportunities with derived solutions which they have discovered themselves. Its also interesting to note employees are free to choose the topics or issues in the quality circles Few of the very famous subjects are related to health , safety at work while maintaining productivity and ensuring proper product design Few very interesting elements of Quality circle concept is that the ambience that is maintained as peaceful and thus employees are able to have good mood to think and contribute in the sessions and another important part is that every employee needs to have his turn of contribution to express in the meeting which creates more sense of identity and attachment with the organisation as they feel important and heard while maintaining transparency and mutual respect to one another in the team . To truly do quality circles justice, it is important to meet several conditions. In the first place, the mood needs to be relaxed. People need to feel comfortable and be free to share their own opinion. Every member of the quality circle also needs to get their turn. This is the only way for employees to feel involved and be interested, which will motivate them to contribute. There is also a need to determine a clear goal, so everyone knows what is expected of them. People need to be open to each other’s point of view and listen to all opinions. If an action emerges, clear agreements must be made that are accepted by all employees. An organisation should go for Quality Circles technique : Yes or No Yes only if the organisation is in its matured form and the top management has the let go off silly things and focus on end result approach No if the team can not be moderated form day one of formation and clear hand holding given and otherwise the freedom aspects and hierarchy free arrangement may lead to misuse and also side-line main administration channel
-
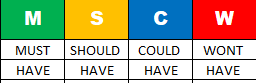
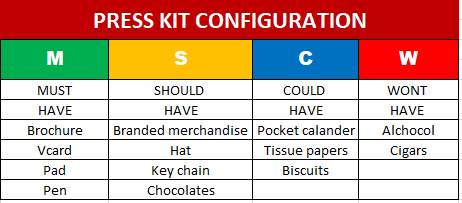
Most of the projects fail due to inadequate delivery with quality issues or excessive delivery with over shot time and budget . This primarily happens due to lack of prioritization in a very basic level . Most often it’s a misnomer that one tends to overdo in project assuming that customers need it but it would not be the case always . It is better to define customer requirement by using MoSCoW technique First let us understand what these alphabets stand for Must have is denoted by - M which is essential and a prerequisite for the project and its not negotiable and it’s a must have type of requirement Should have is denoted by – S which means we need it in the project if at all possible but not mandatory Could have is denoted by – C which is nice to have kind of scenario if we have the time and budget that permits it Wont have is denoted by –W which completely out of scope is which is completely out of the radar and scope and we do NOT need it at all this time Example :- Management has given instructions to the team for preparing a Press Kit for the Press conference and the Project Head has given the requirements and the same has been split by using MoSCoW thechnique and the Press kit is prepared . In Business Analytics MoSCoW when used will give following benefits

-
When we wish to improve the performance of an organisation it will be default have changes by design and they are inevitable . We must know how to manage the changes and in order to do that we use Change effectiveness formulae Q x A = E Change Effectiveness equation is used in a program named Change Acceleration Process which was proprietary method of GE named CAP and this was a more like a pilot to Six sigma implementation to bring cultural transformation This was used in GW during early 90’s amidst Gulf war and Internet explosion and Globalisation as a transformation tool . The Equation is given below Q X A = E In which Q – depicts Quality and or Technical strategy of the Organization for a change initiative . Even resources like tools ie Minitab etc are also covered under Q A depicts Acceptance or Cultural Strategy or Soft strategy which includes People skills , Interpersonal skills , Team management skills and Facilitation skills . E is the Effectiveness of deployment of change initiative or management Most of the times there will not be major problems in achieving Q as its more like an resource /method and hence SOPs and KRAs can bring the effect in this element . A is the challenge as people are involved who have variety of personalities and attitude which have to be managed . Hence it is important to concentrate more on A by bifurcating and expanding in depth We can expand A – Acceptance in to Accountability and also Ability to accept which are measurable and thus we can have AAA in the system In order to manage the change the leader should take in to account all the elements and monitor and managing change effectively by implementing a Change Acceleration Process Model which can be seen below with elements in order Related to Project Management as how a Project Head or Leader can effectively manage CAP . Its called the CAP method which is all about monitoring whether you are doing the right things at the right time and it’s a Risk Management tool by which we can decide the prioritization and also monitor the associated responses . CAP stands for C – Categorize Risks A – Assess Risks P- Prioritize Risks We can create a Risk Register to capture all elements C- Categorizing Risks can be in to the following Scope / Schedule / Budget and Quality . In some projects we can also use RBS – Risk Breakdown Structure to have a more granular approach A- Assessing Risks can be in to the following Qualitative Risk analysis and Quantitative Risk Analysis so that all the risks are assessed with significance Normally Qualitative risks are measured in the following scale Very High / High / Medium /Low / Very Low We can also use Probability /Impact matrix with a scale of 1 to 5 Quantitative Risk analysis is tedious and only if very critical micro elements are going to affect the project it is done and in such conditions following methods / tools can be used Sensitivity Analysis / Monte Carlo analysis / Expected Monetary Value / Decision Tree Analysis and Three-point estimation tool P-Prioritising risks Risks can be in to the following We have to prioritize in order to obtain most value for our efforts . Pareto principle talks about 80% of issues in the project will come from 20% of your risks and hence its important to prioritize by assigning proper human resources as Risk owners so that immediate action is taken by them once the threshold is crossed .The risk owner should have Risk Response Plans including contingency plans and fall back plans –Plan B One more advantage is this will help us to reduce cost


-
Cost Benefit Analysis is a decision making tool . It has some very basic calculations on expenditure and benefits and a ratio is arrived at to infer if a project is good to do or not . Its also a risk assessment tool . Both costs and benefits are measure in monetary terms and not by any other metric We can also extend the scope of analysis by calculating NPV and adjust the future cash flows and costs to present day . After that we can do a sensitivity analysis and evaluate the results and give our inference as positive or negative Some times opportunity cost is also linked while arriving at CBA results which is an interesting aspect In many models, a cost-benefit analysis will also factor THE OPPORTUNITY COST into the decision-making process. Opportunity costs are alternative benefits that could have been realized when choosing one alternative over another. In other words, the opportunity cost is the forgone or missed opportunity as a result of a choice or decision. Factoring in opportunity costs allows project managers to weigh the benefits from alternative courses of action and not merely the current path or choice being considered in the cost-benefit analysis. By considering all options and the potential missed opportunities, the cost-benefit analysis is more thorough and allows for better decision-making.
-
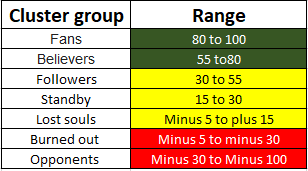
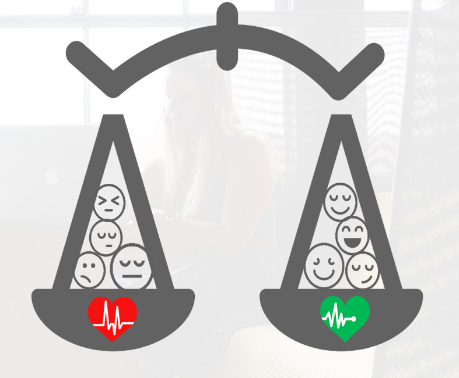
Customer Loyalty is categorized in 4 types 1. Contractual 2. Transactional 3. Functional 4. Emotional If we are able to measure and analyze emotional state of customers and stake holders then the final resultant is known as EMO Index . Thi9s phrase or term is also a registered trade mark of an organization called EMO Insights International It is believed by industry experts that EMO index is more reliable than Net promoter Score This indicates the general feelings of each and every customer / group of customers or stake holders while using the products of services of a company . It is known as Net Emotional state and Net intensity balance and hence this can be measured from -100% to +100% While the index is calculated in an individual level its classified in to seven broadly framed emotional states and this is called EMO clusters as below Its said that Emotions are better predictor of whether a customer will return than conventional loyalty measures

-
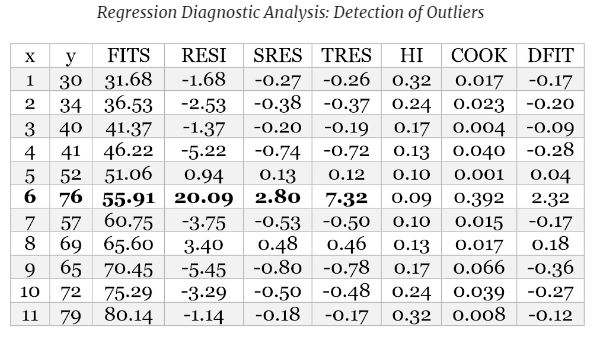
While doing Regression analysis to arrive at the best fit line we can observe some unusual appearance on the data points with respect to its y-value or x-value. Instead of calling them x- or y-unusual observations, they are categorized as leverage or outlier and these are considered as influential points as they obviously impact the outcome of the regression model. These unusual observations aka outliers aka influential points are observed on x-value or y-value. Its interesting o note an x-influential point will make the scope of regression analysis too wide and hence considered less accurate . An x-outlier is rare and when it occurs it may heavily impact the regression results . In an observation it is normally considered an outlier if the absolute value of the residual is higher. For instance If we see the data point on row # 6 it has a very high residual compared to any other data points of the data set. Generally, higher absolute value for any of these diagnostic statistics for a point is considered an outlier The absolute values for the other diagnostic statistics viz adjusted residuals , standardized residuals (SRES) and deleted residuals (TRES) are also seen to be much higher than the data point of row#6 In order to statistically determine the influential point we use DFIT and Cook Distance method If the absolute value of DFIT exceeds 1 for small to medium data sets this point is considered as influential points to the fit the line of regression Significance of leverage point by following example line Let us see the relationship between muscle mass and power . IN the following study most of the individuals have their weight around 200 pounds and one person weighs 400 pounds . This is an extreme y-value which is power which will override the relationship more than all other individuals Leverage Point in a Regression Analysis( pic at right ) Influential Point shown in a Regression Analysis We can notice that leverage points normally make the functional regression relationship very broad and hence the conclusion of the study would be misleading Therefore, the conclusions for the study could be misleading. In a general note we can say a wider model is considered as less accurate compared to a shorter one and hence to have more accurate results shorter models are preferred General note :- Many a times different sets of data which we would be considering as x and y may have a linear incremental relationship and as the process has a continuity and when its in chronological order the correlation will establish stronger . However the influential points impact would still be critical . If we see You Tube scenario a particular video which has views / likes / comments and subscription which are chronological in nature but definitely has an influence on one another . In a common man angle if you approach this scenario we can say if a video is viewed more then the likes can increase and if likes increase then possibilities of views will increase as the person would see it again but may not register like again and in next level the more one sees it again and again that person would enter comments and if the video is liked extremely well then the person may subscribe t that channel . But we can still find the outliers and influential points if we are comparing videos which has thousands in range and if it is compared to videos with million views we can see the impact


-
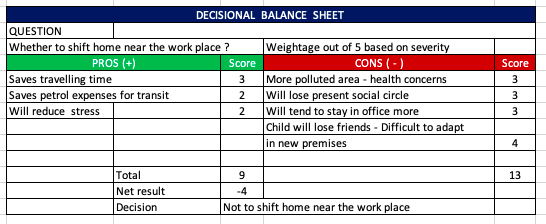
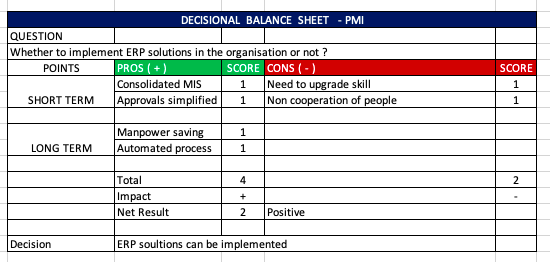
Decisional Balance Sheet is one of the simple continuous improvement tools widely used for taking both personal and professional decisions . This is probably carrying the DNA of SWOT analysis approach but here the elements are much more fundamental and prima-facie visible than using analytics to arrive at for assessment . It follows a simple matrix which can look like quadrants with both Pros and Cons listed on ta tabular format and weightage is given on for or against to arrive at the net scope and which ever dominates in pros and cons would be the decision which one can take . If we take a try primitive example of a personal issue on which one has to take a decision . Whether I should move my home near workplace ? The below example would give the pros and cons which carries merits and disadvantages of various elements including , financial , time , health , social angles etc . This can be extended to a PMI which is known as the Plus -Minus-Interesting as well . We can also introduce short term and long term benefits of few decision and give weightage for few elements which can be finally calculated for arriving at the net effect . In a professional environment when we have to take a decision in an organisation with collective in-put from many the following example can be quoted Whether to implement ERP solutions in the organisation or not ? Decision matrix is a evolved and more sophisticated form of Decisional Balance Sheet Balanced score card is again the top end of this concept which is a hybrid between a Financial balance sheet and Elements causing the effects on the financials . Even in Psychological domain this concept is used in ABC model and also in DBT - Dialectical Behaviour Therapy .
-
North star metric is the goal post towards which the whole organisation would strive to reach with full focus . This focus can be seen in a consolidated aerial view where all the departments and assignments are done with this as a theme . While all departments would be focusing on OMTM which is mostly assignment or project based and also a short term objective . The progress that is happening on North star metric is visible to all in real time basis or made to be visible so that quick corrective actions and preventive actions can be taken if there is even slightest deviation . Another important aspect of NSM is that it drives the organisation on along term basis for many years and at times even decades together . It will be advisable to keep this NSM as the top most agenda or goal in any system oriented approach or any continual improvement process the organisation is working on .
