

Beena Ram
Members
-
Joined
-
Last visited
Everything posted by Beena Ram
-
What is SQDC Board? This is simple and most used visual management tool in manufacturing industries. Safety, Quality, Delivery and Cost are monitored on a daily basis which will help to know how the manufacturing unit is performing on these key areas. Safety – is an important metric which reviews the safety of the employee at work. always this is vital hence comes first and could help us to get to know the mere misses, safety violations, accidental injuries at workplace, and unsafe work practices observed. Audits done on availability of Fire extinguisher, Seating chairs safety, Machinery safety. Quality – this metrics reviews the number of product defects found in a day or any returns due to poor quality of goods produced. Delivery – metric measures the goods delivered status as planned and actuals. Especially emphasis on On-time deliveries to customers or the number of shipments made per day versus the goal. Cost – is a metric that deals with expense which mostly related to non-value activity or waste, rejection waste, penalty due to non-conformance, late charges, spoiled leftover raw materials, and overtime costs to employees due to improper plan. When is SQDC Performance Metrics measured? We can set Daily, weekly, or monthly goals for each category in the SQDC Board and can be measured accordingly and update the results on the visual board kept on the workshop area. If the teams meet their target set on each category, it is marked in green color for that period. If not, it is marked red in color. Team updates the status on a daily basis and tries to meet the targets and so on. How SQDC Board can be used for process management? This SQDC board helps to assess the process and track the results based on the goals of the company. This kind of visual board helps to understand visually what the target is and where we stand based on the results. It is very easy to bring in new changes in the process based on SQDC board as it instantly shows the status either problems or solutions to some prone issues. This board also helps to know the progress of any new initiative on a daily basis, hence any changes can be done instantly. This SQDC board serves as a tool to help the team to constantly strive to achieve and improve the process The management also arranges to observe the actual work process, engage with employees, gain knowledge about the work process, and explore opportunities for continuous improvement. Thus, does a Gemba Walk, so that they can promptly know where the unit stands by understanding and looking at the board. Month on Month trend will help to get an idea that what has happened in the past and also can predict what will happen in the future.

-
About Rapid Application Development (RAD) A software development model that helps the software programs for a speedy prototyping and feedback especially on the project that took a very longer period due to complex coding and testing phases. Using RAD approach, the programmers need not worry on creating a software coding from the scratch each time but can create small portions and add them as a modules or patches to the existing one. RAD is a development model was introduced during 1980s when traditional Waterfall Model was become Obsolete. Why RAD emphasis on prototyping than planning? Rapid application development always emphases on speed and uses small team hence the development time is less and quick whereas other models usually emphasis on creating a product liked by customer, large team and specialization. RAD prefers to get feedback on the prototype and ensures to stay till end of the development cycle Is RAD approach suitable outside software development sector? The RAD approach can be used in business re-engineering. The idea of business process re-engineering was to drastically rethink core business processes like sales and customer support with the new capabilities of Information Technology in mind. RAD was often a vital part of larger business re-engineering programs. The speedy prototyping approach of RAD is a key tool to help users and business analysts to do "think out of the box" about innovative ways that technology might radically reinvent a core business process.
-
Comparison RAPID DACI RACI Stands For Recommend, Agree, Perform, Input, Decide Driver, Approver, Contributor, Informed Responsible, Accountable, Consulted, Informed Descriptions Recommend - Recommends a course of action Agree - who must agree with a recommendation Perform - who will perform the decision Input – who provides data to recommend Decide – who is a decision maker Driver – who drives the decision Approver - who makes the decision Contributor – who aids their skill and expertise in the project Informed – who might be affected by the decision hence need to be kept informed Responsible – Who does the work Accountable – Who owns success/failure of project’s outcome i.e answerable Consulted – Who can offer expertise guidance for the team Informed - who need to be kept informed, i.e CC When it is used? Used to defines/recommends who should be doing what during a project Used to define the roles of a team in decision making in a Project Used to define the roles and responsibilities of an individual team members against each task in a Project/Process How it works? Focuses on assigning level of decision making Focuses on decision making Task Oriented and Focused on deliverables Where it is used? Larger projects which require difficult or complex decisions Larger Projects which require Strategic decisions Project Management and Lean method
-
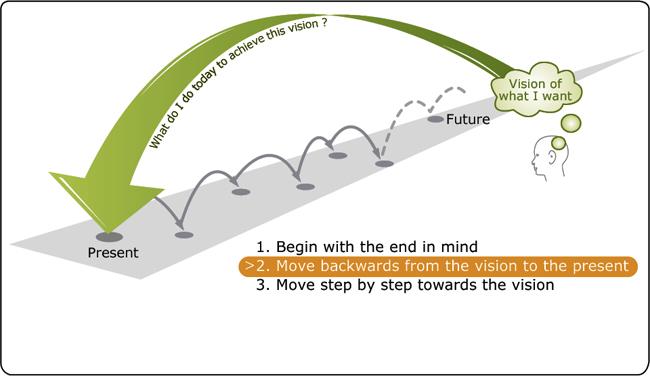
Backcasting is the method that works from towards the back, unlike others which starts prediction of future based on the analysis and work towards achieving them. But Backcasting starts with setting a desirable future and then works backwards to find the ways to achieve by linking the desired results with future to the present. Backcasting method was developed by John B. Robinson from University of Waterloo in 1990. Backcasting is a problem-solving method whereby we first imagine a desired outcome and then act towards back to identify the choices and actions that will assist us to reach that outcome. Take an example. A person wanted to reduce weight to 70 kg in 5 months. To arrive the result, think “If we want to achieve an outcome, what steps must we take to arrive at that outcome?” Next step is to check the current body weight and know how much he needs to reduce. Hence, he checks his current body weight and know the amount of weight to be reduced. Then he needs to take steps to achieve the desired results. So, the next step will be planning the amount of time to spent in walking, jogging, workout exercise and diet plan. This steps to reduce the weight will be continued until we arrive at a realistic result.

-
What is ECRS ? ECRS expanded form is Eliminate, Combine, Rearrange and Simplify. ECRS is one among the Lean process improvement methodology which uses special methods to achieve process activity optimization. What are the ECRS methods with examples? Look at the process map and apply any of the methods on each step by asking relevant questions 1) Eliminate – Check for any process step that can be quickly eliminated without affecting the end desired output. Questions to be asked: Does this step add value to the process? If answer is “no”, this step is highly wanted step that should be eliminated Examples: Printing Process – Can we avoid taking printout? by working directly on the input which is received in .pdf file or use a dual monitor to look at the details. 2) Combine - When Eliminate method cannot be applied, then try to find the process steps that can be combined. Questions to be asked: Who does this? Where it is done? and When it is performed? Examples: Document Verification Process – Processor A collects the documents from customer and uploads into a system. Then Processor B downloads, verifies, and provides comment if there is any discrepancy. Here we can check whether we can skill the Processor A to perform the verification steps also. By combining the steps, Processor A will receive documents from customer, verifies and then uploads the document in system. 3) Rearrange – Check for the process steps that can be rearranged which will save time or cost or improve quality Questions to be asked: Can we change the sequence of the steps? Examples: Loan Application Process – Processor A collect documents from customer, does the Data Entry on the Loan Application and then verifies the completeness of documents. If there is any doc deficiency, Processor A puts the application on-hold, contact customer and collects required docs. Here we can change the sequence and see the effectiveness of the process. First collect documents from the customer, verifies the completeness of documents and does the data entry in the Loan Application. This way Processor A can avoid filling the Loan Application if the customer has not provided all documents. 4) Simplify – Last but not the least, this is an easy method to simplify the process steps by either breaking them to smaller process steps Questions to be asked: What is the best way to do? Examples: Reconciliation process – In place of manual preparation of reconciliation, we can create a Macro which will avoid errors and save time. Remember the thumb rule is to make the process Simple and Easy to learn and execute. Hence, prepare a Detailed Process Map, discuss, and review each process steps that can be Eliminated, if not, then Combined, Rearranged, and Simplified. Once we are done with this workout – go out on the process floor and implement it.

-
"Work expands to fill the time available for its completion." a job takes all the available time before getting finished. The idea of Parkinson’s Law is to do a job in less time, without compromising quality over quantity. Time Management We all have a common opinion that staffs complete tasks in the time assigned, not before. Staffs give themselves extended than required because they feel the essential to add cushion time. If you give a staff a weeks’ time, to finish a two hours job - it will take a week, but lesser time. How we can improve the productivity of the team using this law : 1. Allot accurate/realistic amount of time to a job 2. Always focus on getting the job done rather then allotted time to perform a job 3. Have a stringent deadline with no scope to extend 4. Have the job broken into smaller and set deadlines for each 5. Create backups to handle jobs on behalf of another 6. Make use of Dead time

-
The Blindspot Analysis discovers hazardous, inadequate, inappropriate and obsolete conventions that can hinder decision making within an organization. Recognizing and eliminating Blindspots is of vital importance for effective strategic decision making to minimize the chance of making wrong decisions.
-
LIFO, is a form of inventory administration wherein the product or material received last, is disbursed first and thus the stock in hand, consist of newest batch. On the other hand, FIFO is another method of inventory administration, in which the product or material received first is disbursed first, i.e. the issue of goods is done from the latest lot and the stock in hand comprise of the newest batch. LIFO Example: Lets see this example, In a cylindrical box, we have dropped 3 balls one after another firstly Red ball, followed by Yellow and Blue balls. If you need to empty this box, you need to take out the Blue ball first which was dropped last. Here Last-In, First-Out (LIFO) method is followed wherein last unit to arrive in box or more recent to take out first. But LIFO is not realistic for many companies because they would not leave the older inventory sitting idle in stock. FIFO Example: Lets see an example for First-In, First-Out (FIFO), A Ticket Checker in a Ticket Counter issues the ticket whomsoever came first to the counter, hence the oldest person in the Ticket Counter queue will get the chance to buy a ticket than the newest person who came last in the queue. Here FIFO method is followed and is the most logical choice, since companies typically use their oldest inventory first in the production of their goods.


-
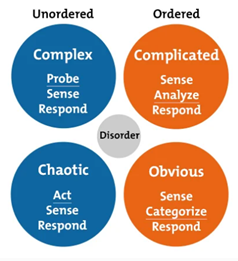
Unlike Other Problem-solving tool, Cynefin uses 5 sections described by cause-and-effect relationships. This problem solving tools helps Business Owners/Project Managers to understand how they look out the issue and also check their own and other person’s habitat in solving the problem. Let see each of the 5 categories in detail using an example to improve Customer Satisfaction Employee Helpdesk : Obvious – This section will have solutions to the issues that are simple and doesn’t require any expertise like Frequently asked questions, Call Tree with predefined solutions. Complicated – This section will have solutions for the general issues but uses expertise to arrive at course of actions by considering risks involved. like High Volume queries, more new hires in Helpdesk, Employee Escalation handling, etc Complex – This section will have solutions generated by doing trials on the resolution, ultimate solutions are arrived by discovering solutions. More time consuming and not possible to find accurate solution and involves risk. after some course of actions, we can move this problem to complicated solutions Chaotic – As it is named, confused solutions are arrived during urgency. Low Call quality, immediate solutions may not work at it best but on a long run, the issue would have controlled due to several actions plans. Last is the Disorder – wherein we don’t know our hidden issues and once we come to know, we will assign them to appropriate sections.
-
What is an Obeya? Obeya is a devoted meeting room created to meet employees and make several important decisions on an initiative or an issue. This can also be used to conduct meeting to brainstorm how to improve productivity, optimize cost and improve customer satisfaction. This is not another meeting room but will have wall board to depict the cross functional process map, value stream mapping, value/non value add analysis, project milestones, project team members details, etc. Some company equips with the help new technology information like dashboard displays, real time production status and more Post-it/color paper, icons, symbols and visual dashboard are main aspect of Obeya. To create the enthusiastic on the project discussion- Posters, Charts, Labels and Graphical methods are used which will help employees visualize and understand information quickly. Why it is necessary ? Helps to create more focus on the problem of the project – More team involvement Information on the Project, Team members and project milestone plan – Create transparency Displays the list of actionable from the project discussion. – Improve teamwork and engagement One place to see the project actions, deliverables and status. – Road shows
-
Customer Lifetime Value is a metric used to measure how a customer is associated with product/brand over a period i.e Customer Loyalty towards a brand. Firstly calculate the Lifetime Value = Average Value of a Product * Number of Transactions * Average Customer Retention Period. Then Customer Lifetime Value = Lifetime Value * Profit Margin Example: A popular detergent company decides to sell the product with the profit margin of 20%. A customer buys detergent powder costs Rs.250 per month and regularly buying it for 10 years. Let us see what will be Lifetime value based on our above example, average cost per product * average no of times bought * average no. of years i.e. ((250*12) *10) = Rs.30,000. Thus the Lifetime Value will be Rs 30,000 for a customer. Now calculate Customer Lifetime Value, apply the values to Lifetime Value multiplied by profit margin of a product i.e Rs.30,000 * 20% = Rs 36,000. To conclude, this metric considers a Customer Lifetime Value and compares the value to the company's predicted customer loyalty.
