

Ramdas Jadhav
Lean Six Sigma Black Belt
-
Joined
-
Last visited
-
Process yield is used to measure process performance. It shows how good process is working and how many defective parts process in producing. In another way we can say that Yield is percentage of defect free process. Formula for Yield Percent = Actual Yield/ Theoretical Yield x 100. There can be serval challenges while calculating accurate and consistent %Yield. It can be with human error while defining defects, Incomplete data, external factors leading to process variation or Dynamic changes in complicated process. For example you take a project to make a lemonade. For successful project completion you need to measure yield percentage and defects. This will help to improve this lemonade making process. To begin with you have to analyze key process steps like Squeezing lemons to get juice, Addition of Sugar and Water, steering or mixing and finally pouring into cup and serving. Here mistakes can be 1. Identical size of lemons- Sizes can be different. 2. Taste or quality- Some of Lemons may be juicy or too sour 3. counting mistakes- Counting of lemons or Coup 4. Difference of Opinions - Some people may like Lemonade, Some may find fault like too sweat, too sour. By understanding these defects you can improve the process and quality of Lemonade further to delight your stakeholders.
-
Reverse Logistics is the process to bring back products from consumer or customers to orgin of supplies. Reverse Logistics is need of certain business and industries where products once sold to customer need to be transport back to orgin or Seller's premises for example Medical Devices, high end electronic devices which need to be transport back to seller's premises if there is any failures, fault or exchange required within warranty period. Now days Reverse Logistics is part of e-Commerce sites like Amazon, Flipkart, Myntra where customers are not sure about the physical product appearance. So Sellers assures return or exchange within certain time. Just to give example from personal assignment. We were in business of Premium Dental Implants. This brand is Inventor of Osseointegration concept and Pioneer in this segments and offers life time warranty. Most of Implantologist/ Dentist are train by this company as there is no formal academic course on Dental Implantology in Dental Medical Colleges. This company's Training and Education team conduct courses for Dental Colleges or Professional Dentist who want to upscale their practices from traditional Root canals to Dental Implantology and Prosthetics. With vary physical condition of patients and Upper Jaw and Lower Jaw structure, multiple times Dentist are not sure about the size of Implants which may be right fit. Hence they always orders implants and related prosthetics in excess of 1:3. As patients surgery can not be postponed due to lack of implants are related material. While placement of Dental Implant they can Check and use the right size and return unused Dental Implants which are very costly to Seller Company to get the credit notes. so 30% of Sold Dental Implants and related restoration material comes back to Seller warehouse/ Origin for exchange or return. In addition there will be failed implants either due to Patients condition like Diabetic, Oral health Hygiene Issues. Company need to analyze these failed implants cases and submit Report to Medical Authority ( FDA) called as Post Market Surveillance. Here LSS help me in two areas 1. Analysis of Data Points - Failure Analysis and submission of the data to Central Clinical Research team timely. As this process was complicated as Reverse logistics of failed implant from patients mouth can be health hazardous material. so it need to be sterilize and transported back to research center in Europe within 48 hours from reporting of failure. LSS helped to Deploy Control Chart on reporting timelines, packed condition, Patients information . 2. Value Stream Mapping: Since Dental Implant industry in highly un organized indian Market. There were lots of compliance issues while return or exchange or Implants with threat to cancelation of License to operate. So we did through process flow mapping and introduce Reverse Logistic process with help Professional 3rd Party vendor i.e DHL. Process was similar to Car Service where Dentist need to confirm and share the photos or product returned with DHL to get credit note with 72 hours from return. The above points provide competitive advantage to company as process was simple, transparent, fast and accurate for Dentist and their account receivables were getting reconciled within 72 hours also it provide them facility to get all possible options/ products to complete Patients surgery within time without any hassels.
-
Leavy Jennings chart are a very good way of visually representing QC data providing indication of the performance of an assay. This graphic tool is used in monitoring controls and ensuring that they within desired limits. The L-J Chart allow us to plot the data and records of periodic measurement of quality control samples and then it analyze whether data points are within acceptable range. Chart also highlights outliers with mean and standard deviation between 1 to 3 within (+-3SD) so it will have 1. Time value on X Axis 2. Measured value from quality control samples on Y Axis 3. Horizontal line indicating the mean ( Average) 4. Standard Deviation line indicating acceptability of range. Leavy Jennings charts are simpler to detect trend, shifts or outliers but can only work for individual test performance and can not be account for interaction between different test and process. IMR chart are more powerful when it used for general purpose to understand complexity where individual measurement and their range is critical for overall process control. Unlike L-J chart IMR chart can not be tailor made for Laboratory experiments. It is also required statical knowledge and training to understand and interpret moving range and control limits. L- J Charts are used in healthcare industry or laboratory experiment to ensure that test methods are accurate and stable , Where as IMR Chart are used for Industrial or manufacturing set up. For Diabetes testing L-J Chart can be helpful to monitor blood glucose testing. for that we can 1. Established Control limits i.e. Mean glucose concentration of the QC sample = 100 mg/dL and standard deviation ( SD) is 5mg/dL. 2. We can set up L-J Chart with Time on X Axis and Y Axis as glucose concentration levels and mean value line 100mg/DL and SD lines between 1 to 3 SD. Suppose we take 10 days data and glucose concentration level values are 98, 101, 100, 99, 95, 97, 103,102, 104, 96 mg/ dL. Most of the value are within +- 2 SD that mean testing process is in control. Benefits of using L-J Chart Early detection of issue will help correction which is vital for effective management of diabetes.
-
Payback period is one of the simplest method to measure project profitability and risk. Payback period simple meaning is time taken to recoup the initial investment. It is useful when company has limited resources and need to know how quickly they will recover their investment. Calculation of payback period = Initial investment / Annual cash flow. Since payback period is very simple compare to other investment investment or project appraisal techniques. a. for example IRR ( Internal rate of returns) help to analyze and compare the incremental profit in terms of rate of returns Vs. Risk to be taken for example. if we invest same amount of money in to Financial market ( Equity/ Debt) we may get average 10% IRR Vs. Project should reflect 5-7% incremental returns for efforts, time and risk taken on the project to justify the project selection. b, Net Present Value indicates difference between present value of cash inflow and cash outflow. Here NPV of any project negative then you should not accept the project is thumb rule. While projection selection all three method or financial metrics can be use but payback period suits to organization with limited resources and high intensity cashflow/ liquidity requirement. Lets understand advantages and disadvantages of using Payback period while project selection. Ram wanted to open Small Cafe. He needs 1000000 ( 10 Lakhs) as initial investment. He tells his friends and relatives invest in this business as it will give him 100000 ( 1 Lakhs) profit every month. Payback period = 10 Lakhs/ 1 Lakhs = 10 Months. Now the funny part 1st Month Ram Open Cafe earns 1 Lakhs 2nd Month there was big event like fun fair, exhibition happened near to his cafe. Profit for this month increase to 2 Lakhs. 3rd Month there was coronavirus 2nd Wave hit and all shops, cafe were closed for month. So No Profit. 4th Month, 5th and 6th month his profit was again 1 Lakh per month. 7th and 8th Month there was 3rd Wave of COVID 19 so no profit 9th and 10th Month there was bulk order from big corporate event leading to profit of 3 Lakhs . So Profit so far is 9 Lakhs and still need 1 more lakh profit for Break even. Considering up and down his relative were very happy and start taking more bets on his idea and encouraging him to expand his cafe chain by opening 1 more outlet, delaying the payback further. So learning here payback period is simple and help assess risk of investment but it ignore 1. Time value of money 2. Cash flow after payback 3. Doesnt measure profitability. So Payback period is useful when liquidity is highest priority .
-
Botched Run in designed of experiment refers to kid of mistakes which change original recipe and may affect the test results. for example we testing effect of 7 Different spices on taste of a Briyani Rice. Lets say in one of our test we accidently add too much chilies, more than the recipe called for. This mistake changes original recipe and may affect the test results. However as long as the changes are not too extreme, we can still analyze and learn from experiment. This kid of mistakes called as " Botched Run" . In DOE, Deviation from planned settings can impact the study's output in serval ways. 1. It may altered results by reflecting true effect of the factor being studied. 2. precision of the experiment's result might be reduced. 3. Overall validity and reliability of experiment can be questioned. To prevent these errors in Design of Experiment ( DOE) you need to take following preventive measures. 1. SOP for experimental procedure. 2. Training and detailed planning on the SOP and execution of SOP. 3. Pilot run if possible 4. Regular monitoring of experiment in progress to catch deviations early and correct them. 5. System to report, highlight errors as soon as they occur. Above steps can help to maintain reliability of experimental results.
-
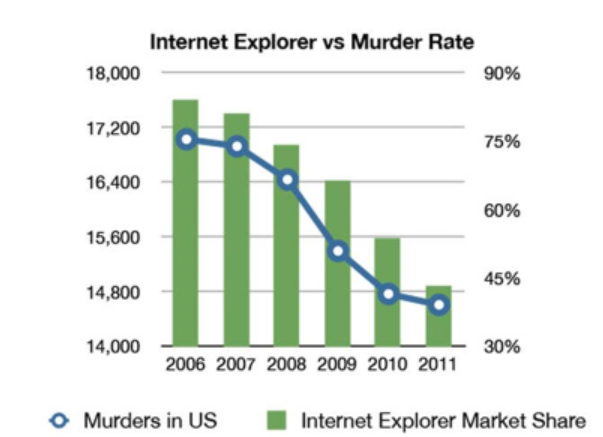
Correlation of coefficient helps to establish relation between predicated and actual value in statistical experiment. Calculated value explain the exactness between predicted value and exact value. It assess strength of association between data variables. Karl Pearson's person method is most common which measures the strength and direction of linear relationship between two variables. If x & y are the two variables of discussion, then the correlation coefficient can be calculated using the formula There are two type of correlation i.e. Positive or negative relation. Perfect correlation of coefficient means where 100% of the time, variables in questions move together by exact same percentage and direction. Perfect correlation is use in Super Market or e- Commerce platform where Time spent by customer in the Store or website can be established perfect correlation with money spent by customers. Also similarly in real life fuel efficiency of car and money spend per kiliometer by car user for fuel charges can be calculated. Sometime researcher can misguide report users through misguided analysis as it only show degree of association but not confirm agreement. for example internet explorer vs. Murder rate. It can lead to erroneous conclusion.
-
Any Manufacturing company should produce product your customers want to pay for. To find out that your process are capable you should use Cp, Cpk,Pp,and Ppk. Capability indices like Cp and Cpk are related to Customer specification whereas Performance Indices are related to Process Specifications. Capability indices are related to engineering specification determined by customer to observed behaviour of process. Capability of process is defined as the ratio of the distance from process center to the nearest specification limit divided by a measure of the process variability. Cp =a Simple indicator or Process capability. Cpk= Adjustment of Cp for the effect of non centered distribution. Cpk measure how close you are to target or specification limit and your consistent around your average performance. a person may be performing with minimum variation but away from specification limit may have high Cp. Also even if person is performing near specification limit with high variation may have high Cp Cpk will be higher only when you are meeting target or specification limit with minimum variation. As per standard you should have Cpk of 1.33 ( 4 Sigma) to satisfy most of the customers. Pp= a simple indicator of Process performance. Ppk= Adjustment of Pp for the effect of non centered distribution. Ppk Measures sample generated fro the process is capable to meet customer specification or requirement. Ppk is used when process control can not be evaluated for example pre-production run. Difference between Cpk and Ppk. Cpk tells you the process is CAPABLE of doing in future, assuming it remains in state of statistical control. So it is for short term. Ppk tells you the how the process has performed in the past. It is more realistic. So it is for Long term. While using DMAIC, it is more realistic to use use Pk and PPk than Cp and Cpk as the process variation can not be tampered with by inappropriate subgrouping.
-
Total Productive maintenance ( TPM's) main objective is to eliminate waste, defects, accidents and breakdown by involving everyone in the organization in continuous improvement activities. Following are eight pillars of TPM. 1. Autonomous maintenance. - In manufacturing plant, Operators are given responsibility to clean and maintain equipment and machine. for example lean practices like 5S can help here to prevent break down and improve productivity at certain level. 2. Kaizen or focus improvement - Kaizen events or Blitz are planned with cross functional team to discuss and address concern/ issues related to machine and equipment's. 3. SHE ( Safety, Health and Environment ) - In includes both corrective and preventive measures related to employees health, safety and environment related issue like carbon emission. 4. Quality Maintenance - To see products are defect free and avoid any re-work it is important to have quality maintenance for example preventive measures like production start up check list. Corrective measures like RCA . 5. Planned or schedule maintenance 6. Training and Education of Operator. 7. Early management of new equipment's based on parts and life cycle. 8 Administrative work to ensure that SOP and all above pillar are manged. TQM TPM is apart of TQM which Broder concept. Total Quality management is customer focused and objective to deliver product defect free where as TPM focus on productivity improvement through machine and equipment maintenance. Overall equipment effectiveness is important Key measures of TPM where as Defective parts per Mn ( DPPM) is key measure of TQM.
-
OEE ( Original Equipment Effectiveness) is calculated as Availability X Performance x Quality= OEE. Availability = Availability of the Equipment which is basis on Run time / Planned production time. Run time can be calculated as of Planned production time - Stop time. Here there possibility of artificial inflation of Run time by reducing planned production time which can be fix based on RCCP ( Rough cut capacity planning) Performance = It consider maximum possible speed of equipment when it is running. This can also be manipulated by setting up Run Time incorrectly. Quality = First time Right. It consider parts that need to rework or not meet the Quality Standards. So formula to calculate First time right very simple. No of rework or Defects /Total Count. for correct OEE ( Original Equipment Effectiveness ) we need to aligned parameter like Planned production time, Run time need to be predefined as per Industry benchmark study.
-
PDPC is also known as Tree Diagram or Decision Tree. Tree Diagram or Decision tree help to prepare contingency planning as its allow to draw multiple branches or scenario with possible decision and repercussion of the same with Cost attached to decision. Process improvement project can always have multiple scenarios with efforts and cost attached to efforts ( time and money). PDPC help to prepare alternatives in order or priority to facilitate decision in scientific manner. Practical use of Decision tree : Option 1. Purchase of Heavy High tech Equipment or Modern Machinery keeping future requirement and residual value which will also help reduce time to complete project- Cost 100K Benefit 1000K USD Option 2 : Getting machinery as per requirement to get work done - Cost 50K Benefit 250k USD. In contingency plan you can execute improvement project even with Option 2. Hence PDPC help you to detailed out various branches with cost and benefits and prepare you for contingency plan if it need to be executed.
-
Both the test are for comparison of Sample Mean Vs. Known Mean. Following is the Key differences between 1 Sample T test and 1 Sample Z Test. 1. 1 Sample T test assumes that standard deviation is Unknown vs. Sample Z Test assume standard deviation is known. 2. 1 Sample T test is suitable for small population sample size Vs. 1 Sample Z test is for large population size. Usage of 1 Sample T test can be use for survey of small group with unknown standard deviation. Where as 1 Sample Z test can be use in Clinical trial in pharmaceutical industry where standard deviation is known. for example a company claim than mean score of niraparib anticancer drug trial is greater than 82 with standard deviation of 20. If a sample of 81 patients was selected with a mean of scores of 90 then check if there is enough evidence to support this claim at a 0.05 significance level.
-
1 Proportion test also known as One sample proportion test. It is used when we compare a sample proportion to expected or known Proportion. in our organization it is mainly used in Manufacturing and Marketing Process. Under DMAIC during 1. Define Phase : This test use to define the problem statement for example the Quality parameter of the product is defined and then result are compared. Current company develops Adhesive solution and Proto type for Automotive companies which are compared with results with help of one sample proportion test. Similarly it is also use in Measure and Analyze phase to reduce waste and get the contribution increase.
