

Pankaj Goswami
Members
-
Joined
-
Last visited
-
For any business to be successful it is important to have a strong inventory. It helps us to know what needs reordering and by when. it will help us to know how much stock we have left of an item and how it's performing in terms of selling. It also helps is if the stock is moving and protects it from sitting idle in the warehouse. We should also be curious to know that how much profit my stock is making, so it is not only just important for our record-keeping but also important from tax point of view. There are two main methods of tracking stock and checking out a profit. They are known as FIFO and LIFO. FIFO means first in, first out. The oldest products in the inventory will be sold first and this is how production costs are calculated. The LIFO means last in, first out. The most recent product/item in a company’s inventory gets sold first. It then applies these production costs. Points to be considered when we go with the FIFO method: It's good for record-keeping Inflation will affect the tax Depression means you are paying less for stock The flow of goods makes this an easy method There are no restrictions on financial reporting There isn't much fluctuation. Positives and negatives of FIFO: Positives: Accurate in results Re-counting of old stock does not happen Inflation is also covered when FIFO is used. Negatives: Higher amount of tax to be paid The high amount of data is required to gather the cost of goods, clerical errors can happen. FIFO can confuse profit results due to change in economic periods. Points to be considered when we go with the LIFO method: Record keeping can be complicated. Inflation may affect old stock Devaluation may mean less profit This isn’t a very natural method Positives and negatives of LIFO: Positives: It keeps tax costs down Work well with retail firms who want to work with trends and quickly sell items that are in fashion now Helps to deal effectively with the fluctuating prices of food Negatives: Record a lower profit The variation of prices means that keeping on top of your inventory value and all the layers can be complicated Difficult to keep on top of profit and tax payments.
-
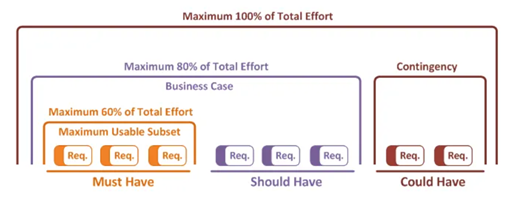
The MoSCoW method is an ordering technique used in management, business analysis, project management, and software development to reach a common thought with stakeholders on the importance they place on the delivery of each requirement. The MoSCoW stands for: M - Must have S - Should have C - Could have W - Won't have The Os are added to make the word pronounceable. Must have: These are not negotiable and it’s mandatory for the team Should have: Important initiatives that are not important, but will add significant value Could have: Nice to have initiatives, it will have small impact if left out Won't have: Initiatives which are not a priority in a specific timeframe. Effort distribution of MoSCoW: Below is the example on MoSCoW: Sr. No Requirement MoSCoW A Users can log onto the website Must B Users should be able to avail of a 'forgotten password' utility Should C Users can change account details Must D A user can send an email to the system requesting a change to the account page Could E When a user clicks on a phone number on the web page a call is made automatically from their desk phone to that number Won't

-
Change Effectiveness Equation The formula for Change Effectiveness is QxA = E, the main components are as below: Q - Quality A - Acceptance E – Effectiveness The above equation can be defined as the effectiveness of any initiative is equal to the product of the quality we can term it as (Technical) & Acceptance from (People) of the strategy. For any successful effectiveness people, acceptance is a must for any change to implement. E.g. Score of Q=100, A=0, E=0 (Best solution/strategy will be not effective till the point acceptance is not there in people) How to quantify these components to maximize the effectiveness is something very important and the key to this equation is how much best solution we can bit and if there is low acceptance of the solutions in people and whole initiative will be not effective. So to maximize effectiveness we have to work on both qualities of technical strategy with increased acceptance towards the solution from people or users. Below are some of the key things which can be performed to maximize effectiveness by working on the quality and acceptance of solutions. The 1st step toward maximizing the effectiveness of the strategy is to create awareness of the need for change & the negatives of the current situation among the users. • Need to show the benefit of the changes and what good things will be preserve from the present. • Need to evaluate impact of changes on people and overcoming potential resistance or perceived loss here we can use participation and Involvement Strategies and Tactics create sense of ownership in the desired change. • Create a proper plan for change which should consist of - Description - Present ( As-is) vs after change - Communication plan – inform everyone and keep up to date with change - Recognition plan – Reward people who support the change efforts - Guidelines - Define standardized process, clear roles and responsibility to reduce conflicts - Measurement – MIS to track the success In short good change plan with people, awareness and involvement will result in maximize effectiveness.
-
A cost-benefit analysis is an approach that businesses use to analyze which decisions to consider and which one to let go of. The cost-benefit analyst subtracts the total costs associated with taking that action from the potential rewards expected from a situation or action. The main key pointers are: • A cost-benefit analysis is the method used to measure the benefits of a decision. • A cost-benefit analysis has measurable financial metrics such as revenue earned or costs saved base on the result of the decision to pursue a project. • A cost-benefit analysis also includes intangible benefits such as employee morale and customer satisfaction. The methods involved in cost-benefit analysis (CBA) is: • Benefit-cost ratio (BCR) • Regression modeling • Forecasting techniques Benefit-cost ratio (BCR): • A benefit-cost ratio (BCR) is used in a cost-benefit analysis that summarizes the overall relationship between the costs and benefits of an upcoming project. • BCR can be expressed in financial terms or qualitative terms. • The project is expected to deliver a positive net present value to an organization and its investors if a project has a BCR greater than 1.0. Regression modeling: • Regression is a statistical method that is used in finance that attempts to determine the strength and character of the relationship between one dependent variable (denoted by Y) and a series of other variables (particularly known as independent variables). • Regression helps financial managers and investors to value assets and understand the direct relationships between variables, such as asset prices and the stocks dealing in those commodities. Forecasting techniques: • Forecasting is a method that uses historical data as inputs to make informed estimates that are predictive in estimating the direction of future trends. • Businesses make forecasting to determine how to allocate the budgets or plan for anticipated expenses in the future. • This is typically based on the demand for the goods and services offered which can be termed as Demand & supply.
-
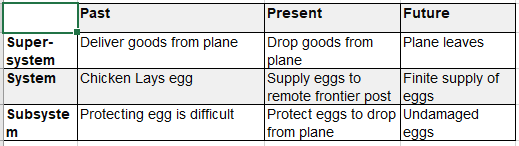
Nine windows is a tool to ensure that teams do not stop developing new ideas and methods for systems, services, and products. It helps to separate a problem in space and time. Once the problem has been cornered, it helps in changing the parameters of the objects based on condition, time, or environment, or all three if needed. Using the nine windows process & exploring a potential solution as a system with time-space dimensions can help to break the psychological inertia associated with repeating the same actions and expecting the same results. The eight causes of psychological inertia are: Having a fixed vision of the solution or the root cause. False assumptions. Any Terminology in a language that is a strongest carrier of psychological inertia. Experience, expertise, and reliance upon previous results. Limited knowledge, hidden resources. Inflexibility, trying to prove a specific theory. Reusing the same strategy. Rushing to a solution, incomplete thinking. The above points can be improved using nine windows. This tool prompts teams to explore a problem in the past and future at both the upper and sub-system levels. Teams extend their thinking about the problem to view it in new and different contexts that are systemic and time-oriented, these groups can break the psychological inertia, and finding the solutions increases. Example: Delivering eggs to Military
-
EMO Index is an indicator that measures emotional state of customer and stakeholder. EMO Index is an individual or group indicator which determines the general mood of each customer or group of customers, stakeholder towards a company, product or service. It is a mix of the Net Emotional State and the Net Intensity Balance and, therefore, can measure values from -100% to +100%. As it is calculated at an individual level, it can also classify customers into seven parts, general emotional states which its creators call EMO Clusters: Fans (+100 to +80) Believers (+80 to +55) Followers (+55 to +30) Stand By (+30 to +15) Lost Souls (+15 to -5) Burned Out (-5 to -30) Opponents (-100 to -30)
-
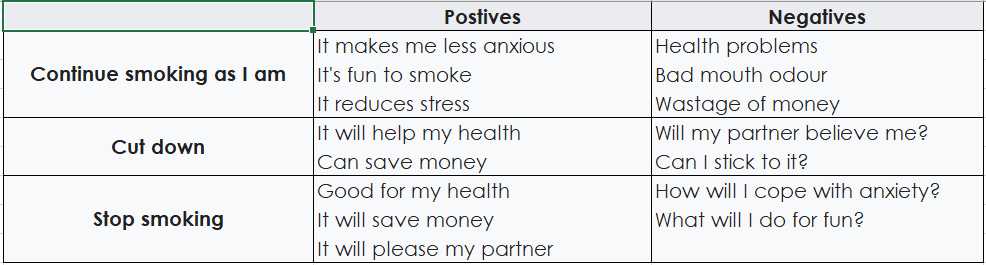
The decision balance sheet is a method for representing the positives and negatives in a table format of different choices and helping to decide on what can be focused to do in a certain circumstance. Thinking through the positives and negatives of both changing and not doing the change is one way to help us make sure that we have fully considered various aspects of our decision. How we can write? Below are the steps we can follow: First, identify the change you are thinking to do. Then, write the reasons that you think in each of the boxes. The next step is to look at your overall picture. Rundown with someone and ask for feedback. And lastly use this information in making the best and healthiest choice for decision making. e.g. If I want to quit smoking, then create the table below: And lastly write the statement as: The Change I am considering is: Quit smoking for living a good and healthy life.
-
A North Star metric is the one measurement that is predictive of a company's long-term goals. To be qualified as a "North Star," a metric must have three points: 1. Lead to revenue 2. Reflect customer value 3. Measure progress It brings absolute focus on one goal of a company that drives sustainable long-term growth. Nowadays, every company needs to know what its customers are demanding and their trends on satisfaction. So by using North Star Metric a company will be laser-focused on its customer demands, what values are they creating for customers. And by outlining the North Star Metric clearly the customer value created is instantly visible and decisions can be made accordingly, and it will not only benefit the company's overall growth but also will add long-term value for its customers.
-
Service Recovery Paradox: In this competitive world, both defect-free production and after-sales service are important. We cannot say that we should be just focusing on after-sales service and not defect-free production because defective products will increase the cost and this will add additional expenses which will drain down the revenue. Also if we have to increase loyal customers then we just not have to fix the defective product but also change the experience of customers by adding values like faster resolution, additional goodies, coupons, etc... E.g. A customer had ordered a product from an online shopping company and the delivered product is faulty and he had raised the complaint. Now first of all the online shopping company will apologize to the Customer and do whatever necessary to increase the satisfaction like speedy delivery of the product, additional vouchers or coupons, etc... so that Customer feels happy about the after-sales service. And at the same time, the online shopping company should do the Root cause analysis and fix the issue to the core so that the faulty products are not delivered to the customer and it will save the transportation, vouchers, coupons cost, and additional product cost.
-
The noise factor is an input process that cannot be controlled and this regularly causes variation in the output. In Six Sigma Noise is commonly referred to as: White noise Random variation Common cause variation Noncontrollable variable e.g. When riding a bike engine temperature depends on the combustion of fuel and the atmospheric temperature outside, here atmospheric temperature is a noise that cannot be controlled. To control the noise first we have to assess it using methods such as ANOVA, DOE, or regression analysis. Some parameters which are easily controllable in our system and which can interact with noise effects, then in those case we can use those control factors to minimize the noise. There are 2 ways to reduce the variation or noise in our process: 1. Using non-linear effects - Response surface DOE can be used to learn curvatures and quadratic effect, and while experimenting we have to look for the sweet spot which has shallow slope. 2. Using Interaction effects - It's a interaction of noise factor with controllable factor. We have to look for slopes and difference between the controllable factors, the lesser slope for control variables on noise indicates that it's handling noise better compared to other control variables.