

Dhirendra Singh.
Members
-
Joined
-
Last visited
Everything posted by Dhirendra Singh.
-
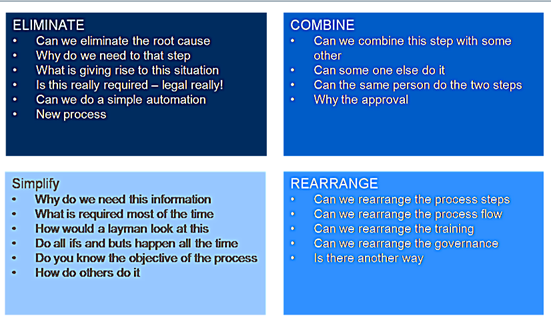
Dhirendra Singh. replied to Vishwadeep Khatri's topic in We ask and you answer! The best answer wins!ECRS Definition :- ECRS method of process improvement can be expanded as Eliminate, Combine, Rearrange & Simplify, it is one of the Lean method of process improvement. The main idea is to look at the process and ask all relevant ECRS questions & then execute to remove/reduce waste. Questions asked in each steps ECRS Process Steps Eliminate :- In this step identify the steps that can be quickly eliminated ( Elimination of non-value added activity). Combine :- In this step if we see work or task cannot be eliminated, then we seek to combine them. Rearrange :- In this step we change the sequence or rearranged of work. Simplify :- In this step try to simplify the work or task. When to use ECRS When immediate need of improvements. When we need to produce quick practical ideas to make the process lean. It can be combined with many other techniques to come up with improvement ideas and quick solution. Sample Example to cover above steps Cycle time reduction in production & Quality Checking team # Improvement Ideas Eliminate Combine Rearrange Simplify 1 Identify repetitive task ( Downloading material from same portal multiple time) X 2 Task planning (Common project tracker file) X 3 Parallel execution ( Instead of complete file for QA send in batches) X 4 QA Checklist, Production Checklist, Communication X
-
Dhirendra Singh. replied to Vishwadeep Khatri's topic in We ask and you answer! The best answer wins!The Blindspot Analysis uncovers incorrect ,incomplete, dangerous and outdated assumptions which can effect decision making within an organisation. Blindspot analysis is a systematic decision making and evaluation process. Most of the other decision making frameworks favor rational and objective action where as blindspot analysis uncovers process of flaws caused by bias or misinterpretation. Below are the some of the types blindspots in decision making Invalid assumptions – Example:- Corporate myths, corporate taboos, or other unchallenged assumptions. Escalating commitment – Example:- when a company doubles down on a particular plan to its detriment. Constrained perspective – Example:- When gains and losses are assessed individually, and not as part of a larger picture. Over-confidence – Example:- Encompassing confirmation bias, an illusion of control, or a belief that past performance is a predictor of future success. Information filtering – Example:- When failure is not seen as a learning experience. Groupthink or herd mentality – Example:- An effect where a group makes a safe and conservative decision which is sub-optimal.
-
Dhirendra Singh. replied to Vishwadeep Khatri's topic in We ask and you answer! The best answer wins!LIFO FIFO Definition LIFO ( Last in First Out) method is an inventory valuation technique, in which the last received stock of goods is issued first. FIFO (First in First Out) method is an inventory valuation technique, in which the first received stock of goods is issued first. Stock in hand It represents the oldest stock in hand It represents the latest stock hand Current market price It is shown by the cost of goods sold It is shown by the cost of unsold stock Restrictions There are restriction from IFRS No such restriction from IFRS Inflation In Inflation condition - Income tax shows minimum amount. In inflation condition - Income tax shows a higher amount. Deflation In Deflation condition - Larger amount of income tax is shown. In Deflation condition - Reduced income tax will be shown Record Maintained Records maintained is high Records maintained is less Storage Storage required compared to FIFO is high Storage required compared to LIFO is less Usage Now a days LIFO is not used as it handles the latest stock in hand first which is unfair because the earliest stock stands in the queue. Now days FIFO used as it is very simple to understand as well as to operate. Examples Aged Rice lots are sold last vs new rice lot because of the value generated by aged rice in stock. Similar to aged wine bottle ( Aged product price are high) Selling of old stock of vegetable, Fruit first due to decay Generally product in Market/Shop shelf front row product place will be picked 1st by customer which was last product place in shelf. Shop representative will always keep old stock in front of self and new stock backside in shell.
-
Dhirendra Singh. replied to Vishwadeep Khatri's topic in We ask and you answer! The best answer wins!Supermarket is one of the 3 pull strategies which can be implemented between to process steps when designing a future state in value stream mapping. The main characteristics of supermarket is to control production where continuous flow does not extend upstream To enables Visual Management Controlled Entry/ Exit of Parts “locked” Provide right sized to support level loaded plan FIFO for raw material
-
Dhirendra Singh. replied to Vishwadeep Khatri's topic in We ask and you answer! The best answer wins!Obeya is Lean concept which focuses on creating a physical space where team strategize and plan the project. Lean best practice to inform and involve anyone in the process , and quickly allow them to see and understand which is in control and what is not through Visual Management. The main purpose of the Obeya is to keep the management team’s eyes on the objective and to develop teamwork Yes it is necessary to have one room ( Obeya) for large cross functions projects as it seen from large companies such as Toyota, Nike ,Boeing ,etc. uses Obeya room and it is benefiting them to promote problem solving among teams, as well as building communication. I would like to shared one live scenario in our organization , we have used the same concept of obeya room to solve one business problem by involving specialist from cross functional team to come up with effective solution. During this period team was working daily in same room ( Training room our Obeya room) till the project was closed. This lean concept has helped team to have focused approach on the finding effective solution with team work & in turn created great team bonding among the cross function team members.
-
Dhirendra Singh. replied to Vishwadeep Khatri's topic in We ask and you answer! The best answer wins!Lean Six Sigma Sponsor:- They are usually high-level or senior business leader or executive who sponsors the Six Sigma engagement. Provides required resources and align resources Ensures Cross functional collaboration Establishes improvement priorities , target and accountabilities Play role model appropriate behaviours and change leaders Ensure project is align towards strategic objective Provide approval for all phase of Lean six sigma projects Ensure project is in budget and on time Approves all change in scope of projects and removed barriers Does the marketing of project results in the organization Lean Six Sigma Champion :- They are middle or senior executive who sponsor & promote continuous improvement initiatives throughout their organization. Monitors external and internal factors effecting the projects Defines business strategy and objectives Does the communication of business plan for success Defines vision of project integrate lean six sigma project in business direction and plan Does the marketing of project results in the organization
-
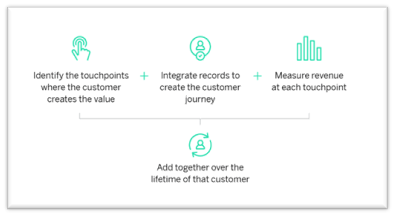
Dhirendra Singh. replied to Vishwadeep Khatri's topic in We ask and you answer! The best answer wins!Customer lifetime value (CLV) is on the metric to track as part of a CX program ( Customer experience). CLV is measurement tool to know how valuable a customer is to any organization , not just on a sales basis but across the whole relationship. CLV is different metric compared to NPS & CSAT because it is connected to tangible benefits linked to revenue rather than a somewhat intangible promise of loyalty & satisfaction. CLV can be measured as shown below Simple calculation with example for customer lifetime value. Customer X’s revenue/ year = $1000 Customer relationship duration = 10 years Cost of acquisition = $100 Cost to serve = $100 per year ($1000 over 10 years) So the math looks something like this: $1000 x 10 = $10,000 $10,000 – $1000 - $100 = $8900 CLV for Customer A = $8900 CLV goes hand in hand with important associated metric CAC ( Customer acquisition Cost) , example , if the CLV of an average Tea Shop customer is $1000 but to acquire them ( via advertising , marketing , offers , etc) the Tea chain could be losing money unless it considered its acquisition cost Key importance of CLV. It is important metric as it cost less to retain the existing loyalist customer than it does to acquire the new customer. Increasing value of the existing customer is more helpful to drive growth. CLV helps organization to build strategies to acquire new customers and retain the existing customer while maintain good profit margins. How to Improve CLV Invest in customer experience (CX) :- Start a loyalty program Recognize and reward best customers Close loop with unhappy customers So in short by understanding customer experience and measuring feedback at all touch points organization can understand the key driver to CLV and plan improvement accordingly. Example, Paid OTT subscription or mobile plan which is basically multi-year relation shift with customer. It is good to spot the early sign of attrition i.e they playing less and less on services over the year.
-
Dhirendra Singh. replied to Vishwadeep Khatri's topic in We ask and you answer! The best answer wins!Quality circle is defined as group of people , employee who does same or similar type of work and they meet regularly to identify, analyze and solve their work-related problems. The participation in the group is voluntary which consist of 3-12 members .The circle group present their improvement solution to management and ideally these circle group themselves implement the solutions as well. This team is highly motivated as they are self-voluntary who find solution and implement as well which has positive impact on their daily work. Advantages of quality circle Teamwork promotion Enhances people positive attitudes Happy work environment Positive impact on productivity and quality Disadvantages of quality circle People not aware of purpose No enough training to find solutions No or little management support No decision making power Yes concept of quality circle is still relevant in organization practicing Lean Six sigma. This tool helps in bringing in large number of small improvement in the organization as this group is highly motivated. Most organization practicing Lean assign senior leader to help these groups as at the end it helps organization to bring in positive improvement. It is always seen impact is good when people themselves are involved as they know the problem & solution is going to help the same group. Also from change quality equation Q * A ( Acceptance) = E ( Effective) when people acceptance is high then impact of solutions is also high, since this group is aware of important of change or improvement so less resistance is there in implementing the solution.
-
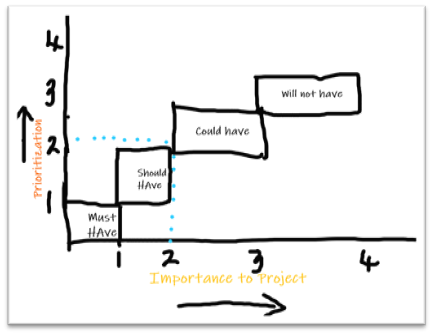
Dhirendra Singh. replied to Vishwadeep Khatri's topic in We ask and you answer! The best answer wins!MoSCOW is prioritization technic for managing requirement and to help key stakeholder understand the signification for initiative/Projects in each phase or release. MoSCoW stands for four different categories of initiatives: must-haves, should-haves, could-haves, will not have. Below are the steps how planning is done based on 4 different categories and Prioritization is done. Must-have initiatives :- As the name suggest these as must have things for any initiatives, it is non negotiation needs of any project or initiative. E.g. Safety parameters of Airlines industry, Medical equipment ,etc. Should-have initiatives :- These are just step below Must have initiatives, they are essential to the project but not vital. They basically add added significant value to the project or initiative. Eg. Productive improvement , fixing minor bugs or adding additional features or functionality which will assist the project or initiative but without them still project with work. Could-have initiatives:- These can be categories are nice to have things in the project or initiatives and it has very less impact to project if not done compared to Should have Initiatives. Eg. Formatting updates and value added services apart from core task. Will not have (this time) :- Here basically initiatives which can be work up in next phase of the project can be added which are very low priority in the project scope of current phase. E.g. Scaling the project for next cross department, launching products in other cities or things part of phase 2 any initiatives. MoSCoW Method for Prioritization :- With the categorization of task based on priorities is an effective method for teams who would like to include stakeholders from the whole organization in their process and Capture a broader perspective by including participants from various functional departments. A very clear categorization helps in making stakeholder understand how much effort goes into each category of any initiative or projects. It is similar to TOC methodology of priorities 1st constrain area ( Mush have) and then work on non-constraint part in the initiates & just like in Hoshi methodology to prioritization on one or two break out KPI for any initiatives or projects ( Must have KPI).
-
Dhirendra Singh. replied to Vishwadeep Khatri's topic in We ask and you answer! The best answer wins!Change Effectiveness Equation The formula for Change Effectiveness is QxA = E, where it key components are mentioned below Q - Quality A - Acceptance E – Effectiveness Above equation can be defined as effectiveness of any initiative is equal to the product of the quality( Technical) & acceptance (People) of the strategy. E.g. Score of Q= 100 , A=0 E= 0 ( Best solution/strategy will be not effective till the point acceptance is not there in people) How to quantify these components to maximize the effectiveness Key to this equation is how much best solution we can build and if there is low acceptance of the solutions in people and whole initiative will be not effective, so to maximize effectiveness we have to work on both quality of technical strategy with increased acceptance towards the solution from people/users. Below are some of the key things which can be performed to maximize effectiveness by working on quality and acceptance of solutions. The 1st step toward maximizing effectiveness of strategy is to create awareness of need for change & negatives of current situation among the users. Need to show benefit of the changes and what good things will be preserve from present. Need to evaluate impact of changes on people and overcoming potential resistance or perceived loss here we can use participation and Involvement Strategies and Tactics create sense of ownership in the desired change. Create a proper plan for change which should consist of Description - Present (As-is) vs after change Communication plan – Inform everyone and keep up to date with change Recognition plan – Reward people who support the change efforts Guidelines - Define standardized process , clear roles and responsibility to reduce conflicts Measurement – MIS to track success In short good change plan with people awareness and involvement will results in maximize effectiveness.
-
Dhirendra Singh. replied to Vishwadeep Khatri's topic in We ask and you answer! The best answer wins!Cost benefit analysis is basically benefits from any initiative ( Process improvement , Automation ,etc) subtracting the associated development & maintenance cost. Example CBA = Total Benefits ( 1 Lakh) – development cost ( 20K) = 80K Actual benefit. Cost benefit analysis in financial terms means revenue earned or cost saving as a results of the decision, initiative pursued on projects. Below are the some of the associated tools for estimation which will help in cost benefit analysis. Benefit-cost ratio (BCR) :- It shows relationship between the relative costs and benefits of a proposed project Regression modelling :- It shows relationship with one dependent variable (X) with series of independent variables (Y) Expert Judgement :- Taking expert people judgement as they will have prior knowledge on similar kind of projects and they can suggest valuable insight based on their experience. Analogous Estimation :- Analogous estimation uses the technique of estimating project with prior similar project completed in the organization using the parameters scope, budget, duration, size, weight and complexity. Parametric Estimation :- This technique uses the algorithm to calculate the cost of current project using historical data of other project variables. Bottom-Up Estimation :- Bottom up estimation technique starts collecting data from lower level and it rolled up to higher level. Three-Point Estimation :- In this technique various scenarios of risk is also considered i.e mostly to complete, optimistic ,pessimistic. Reserve Analysis :- In this technique some fund is allocated as contingency reserve to deal with uncertainty of the project. Cost of Quality:- In this technique we do estimation of cost of both conformance and non-conformance expenses. Project Management Software :- Here we can use the tools such as software application, spreadsheet, simulation and statistical tool. Vendor Analysis :- Here we try to compare cost from various vendor to arrive at optimal cost. Group Decision Making Techniques :- Here we involved group of technical people who are going to execute the projects. Yes in some situation organization give an exception and still take up projects that do not have favourable cost benefit analysis. Example :- Give go ahead to run addition employee benefit programs ,adding budget to run employee engagement activity, force leave programs to reduce stress in the system these will not give direct financial benefit but will have notional benefit like less attrition , employee satisfaction score increasing. Giving go ahead to run audit programs , people safety ,deploy addition security & firewall in system.
-
Dhirendra Singh. replied to Vishwadeep Khatri's topic in We ask and you answer! The best answer wins!EMO Index is termed as individual or aggregate indicator which determines the general feelings of each customer, group of customers or stakeholder towards a company, product or service. EMO index is a combination of the Net Emotional State and the Net Intensity Balance and it is generally measured values from -100% to +100% similar to NPS. Below are some of the EMO Clusters and measure values: Fans (+100 to +80) Believers (+80 to +55) Followers (+55 to +30) Stand By (+30 to +15) Lost Souls (+15 to -5) Burned Out (-5 to -30) Opponents (-100 to -30) It is seen emotional segmentation (EMO) model challenges the traditional (NPS) models used for predicting behavior based social or product sector details below. Sociodemographic variables (sex, age, social class, etc.) Classification parameters (product purchased, volume of purchases, reasons for purchase, etc.) It is generally consider EMO Index is a more reliable indicator compared to likelihood to recommend used by other tools (NPS) , since it is not entirely based on what customers feels or what they will do.
-
Dhirendra Singh. replied to Vishwadeep Khatri's topic in We ask and you answer! The best answer wins!A decision balance sheet is very simple tool to take better decision, Here we can use excel or drawing board to draw two columns table labelled as Pros\Positives and Cons\Negative for the given idea or situation or solutions. Next we will be scoring numerical weights to the different Pros\Positives and Cons\Negative for the given idea or situation or solutions . The Final result which is total of individual column will help us to decide whether to go ahead with the decision or not. Below I have taken small example to explained decision balance sheet where the challenge is to decide whether to watch new movie in Theatre this weekend. Positives Negative Good Director (4) Cost of ticket is high (-4) Good Actors (3) last 2 films where flop (-3) Promo is good (1) Theatre is nearby (2) 9 (-7) Final Decision taken watch movie
-
Dhirendra Singh. replied to Vishwadeep Khatri's topic in We ask and you answer! The best answer wins!North Star metric helps companies to predict company’s future growth using 3 steps process revenue growth, review of customer value and periodic reviews & measure. Since north star focus on long-term goal and keep motivating leader to improve the product, intern providing greater value to customer in future.
-
Yes, Formal completion of BB help to gain knowledge in structure way. Now it's up to project requirements to solve problems by selective BB tools or complete BB steps.
-
Dhirendra Singh. replied to Vishwadeep Khatri's topic in We ask and you answer! The best answer wins!Conditionaly True