Vishwanath Oleti
Lean Six Sigma Black Belt
-
Joined
-
Last visited
Everything posted by Vishwanath Oleti
-
Vishwanath Oleti replied to Vishwadeep Khatri's topic in We ask and you answer! The best answer wins!SQDC is a simple and yet effective daily visual management process as it provides instantaneous visual assessment by constantly tracking process performance against the categories of Safety standards, Quality standards, Delivery and Cost. The SQDP boards display very significant facts about the process performance just at a glimpse. It is very simple and straightforward hence very quick and easy to update every day and maintain it. SQDP boards exceptionally produces effective way of recording and evaluating day-to-day progress. It helps in determining action plan for each process where required. Daily metrics can be agreed and accepted for each of the SQDC category and what has been achieved for the day could be updated on the board. For e.g., S for Safety would indicate whether the safety measures or metrics were achieved for the day, and marked on the board. Safety metrics might include: • No near misses • No safety violations • No missed work due to injuries • No unsafe work practices observed • No safety glasses violations If the business unit or the functional team meets the defined targets/metrics, the corresponding category can be highlighted as green for the day, or red if not meet. For ‘C’, some businesses use it as Customer. Some organisations include M (Morale) as well and maintain the versions as SQDCM instead, where M stands for Morale. Few sectors especially the health care modify S to be a “+” sign and few also include ‘E’ Environment. Below each of the SQDC category there could be 4 or more rows providing details like; o 1st row – Performance o 2nd row – Insights on critical items or identified gaps o 3rd row – Pareto Analysis o 4th row – Kaizen In a production environment, it’s always advisable to adopt and adapt this tracking mechanism by starting at the point closest to customer. This would help business to consistently strive for high quality process performance. Evaluate how the process is performing in direct relation to the product requirement for the end customer. Then put the boards in place moving backward. That might be other departments like warehouse, assembling, packing etc. any respective process that delivers to shipping. Later move the boards in purchasing, maintenance and any other appropriate departments also like the HR, finance, sales, customer service, R&D etc. It is essential to determine the right metrics for the boards. Safety is always top priority. The metrics to be showcased in order of priority i.e. safety, quality, delivery, cost [sometimes inventory and/or productivity], morale etc. Floor-Specific Goals Boards that have the same metric calculation or labour/hour metric across departments aren’t scaled to reflect the specific areas. Customer-driven It is important to note that not only do these goals need to be floor-specific (as opposed to company-specific), but they also need to be customer-driven. Also, bearing in mind that each department’s customer is the next department in line. Strategic Deployment Once the SQDC boards and tracking model is streamlined it is of utmost of importance to align it with the Strategic Deployment and connect it with the wider organisational goals. Sample SQDC Board;

-
Vishwanath Oleti replied to Vishwadeep Khatri's topic in We ask and you answer! The best answer wins!‘Bowling Chart’ is a tracker that displays performances of people, process or system or policy deployment objectives. The format of Bowling Chart appears very similar to that of a bowling scorecard, hence the name ‘Bowling Chart’. It display the actual performance progress against the monthly target that was planned. A simple Bowling Chart would have three columns – List of objectives, target of each object and the actual result that was achieved or delivered. The status is updated with Red or Green colour codes accordingly. Green being target met and Red indicating as target not met. It helps the business and the leadership get a quick status summary thereby identify the poor performance areas and the failed metrics that needs to be focused upon. Designing a bowling chart needs lot of planning. There should be proper governance and control to ensure discipline in maintaining it. Firstly, clear goals & objectives need to be set and agreed. This helps to gain understand what is needed to be measured. Then, we need to comprehend and agree upon the measuring criteria. Without taking away from simple Green and Red visual display, graphical format dashboard could also be designed showcasing period or any other split wise trend analysis. A sample Bowling Chart from i-nexus strategy management platform*; *Source

-
Vishwanath Oleti replied to Vishwadeep Khatri's topic in We ask and you answer! The best answer wins!‘Standardizing leaders work is not possible’ is a myth. If we observe and analyse leaders work prudently, we would understand that their work is monotonous and certainly there would be scope for standardization if not 100% of the work. There may be only few activities which cannot be standardized as it may require human intelligence, creativity, flexibility, and innovation. Leader Standard Work is a set of actions, tools, and behaviours that can be integrated into the day-to-day actions of the leaders. To develop a Lean Culture, similar to the standard work for any process, it is essential that Leader Standard Work too is documented and practiced. It provides a consistent and systematic method for leaders to drive business and process excellence quality projects and derive positive outcome. It helps leaders to focus and run all important activities smoothly. Absence of LWS would lead to variation in actual work done by the leaders across various workstreams and functions of the business at different time and intervals. Hence, planning & executing, being compliant with day to day documentation along with prioritisation, tractions of all critical leader activities is absolutely vital. Thus, the use of Leader Standard Work brings a great value by helping to focus on processes, achieve positive results and avoid variations in work where it shouldn’t be. Advantages of Leaders Standard Work Leaders get closer to the processes and people which they manage. Leaders can answer back swiftly to potential operational challenges and complications and track project progress Workforces/ Team members would know what to expect and see problem-solving as a collective effort. Leader Standard Work provides visual management of daily, weekly, and monthly jobs and responsibilities. Leader Standard Work ensures to optimise people, process and system utilisation Leader Standard Work prioritizes time for other critical BAU activities. Leader Standard Work supports clear expectations and duplicable results.
-
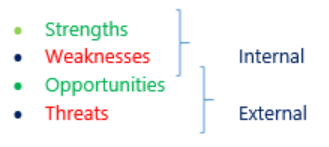
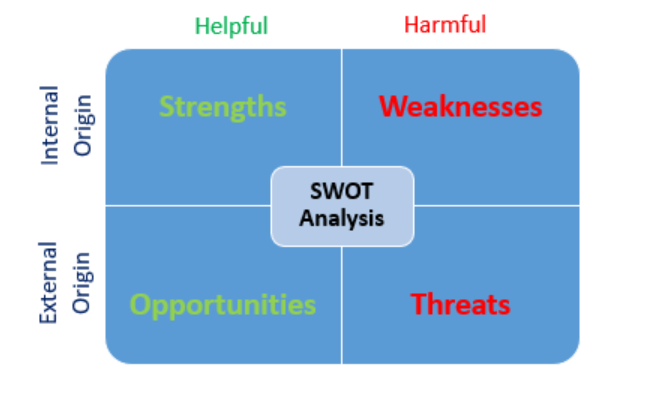
Vishwanath Oleti replied to Vishwadeep Khatri's topic in We ask and you answer! The best answer wins!SWOT Analysis A scan of internal and external environment is an important part of the strategic planning process. With the focus on business vision and to reach the business goals we need to do SWOT analysis. It is vital tool for any kind of decision making The output of the analysis would provide information that is helpful in matching the organisations resources and capabilities to the competitive environment in which it operates. The acronym SWOT stands for; It is a technique used to determine and define the Strengths, Weaknesses, and Opportunities and Threats Strengths - An organisations strengths are resources and capabilities that can be used as a basis for developing a competitive advantage. Any inherent capabilities that we have within the organisation gives and advantage over others… So we need to list those strengths and look forward to build on that. Strengths such as Marketing, Money, Resources, Strong Research and Development capability etc. all are very critical for the success of the business. These help the business grow. We need to analyse and understand what we can utilise that would help the business grow and reach the business goals Few more examples could be o Strong brand name o Good reputation among customers o Exclusive access to high grade resources o Favourable access distribution networks Weaknesses - The absence of certain strengths may be viewed as weakness. It is a BIG problem in the business that needs to be worked upon. Few examples are; o Weak brand name o Poor reputation among customers o High cost structure o Lack of access to the best natural resources o Lack of access to the key distribution channels o Low financial strength o Low R & D capabilities o Low communication skills o Low marketing skills Weaknesses are inherent limitations within an organisation which creates disadvantage over others. A detail and candid analysis of what is going wrong in the organisation will help in understanding, analysing and improve the business. It is very critical and crucial to identify the weaknesses early and try to minimise them. Opportunities These are favourable external factors that could give a competitive advantage Favourable conditions available in the market we need to encash. We need to invest on the opportunities. For e.g. any rise in demand – we need to invest and try to fulfil the demand requirement that help in getting higher revenue and profits. Explore new geographies is another example of grabbing the opportunity. Few more examples are; o An unfulfilled customer need o Arrival of new technologies o Loosening of regulation o Removal of international trade barriers o Market trends New have to be mindful that not every opportunity in the market may be useful for our business. So, we need to figure out the right opportunity at that particular point in time and leverage it. Threats - Factors that have potential to harm. Changes in the external environment that may present threats to the organisation Few examples such as; o New regulations o Increased trade barriers o Shift in customer tastes away from firms products and services o New entrants or o Cheaper substitutes Monitor and take appropriate timely action, so that our business does not get impacted Unfavourable conditions. By identify the threats – we need to counter attack based on the business strengths. More examples summary; Top areas of concerns Threats and Weaknesses External Internal Poor Customer Support Empowerment Complicated buying process Peer interaction Poor communication Work life balance Delay in payments Exchange of best practices Financial terms Sharing of information Business continuity Mutual support Timely reporting Environmental impact Social responsibility Top areas of satisfaction Strengths and Opportunities External Internal Timely Delivery Training activities Product Quality Clarity of tasks assigned Good Reputation Shared resources Transparency Internal reporting Communication Accessibility Ease of doing business Ethical of doing business Workplace impact Market standing/Image We can do SWOT analysis for all the Business, Personal, Product, Place, Policies, New initiatives and any kind of decision making. In an organisation to understand; What skills do we have to reach these goals? What is stopping us to reach these goals? What kind of opportunities do we have to strengthen our weaknesses? What can happen suddenly which stops us to reach our goals? We need to do SWOT Analysis. As we understood that who and why SWOT Analysis needs to be done to help in reducing weakness and improving opportunities, we are underlying the MAXI and MINI business strategy i.e. Maximise Strengths, Maximise opportunities & Minimise threats, Minimise weakness We need to maximise the strengths so that we can grab opportunities. With weakness we may lose out due to threats. So we need to minimise the weakness.
-
Vishwanath Oleti replied to Vishwadeep Khatri's topic in We ask and you answer! The best answer wins!Q 389. What is Kamishibai Board in Lean Manufacturing? Provide examples how this can be used effectively in Service Industry. It is said that ‘No problem is a problem’ Even if there are problems - we are just not able to see a problem. When we speak about Lean, Audits are non-value add. However, we still need them to validate and verify that what needs to happen is happening and we want to make sure we have good quality. Which means we need to have a very robust audit system, one that is takes up as little time as possible and one that is very efficient, very visual, and we want to create that sense of urgency in that dynamic tension. Anyone walking into an area should be able to look at the communication board and be able to tell exactly what is going on. This is where Kamishibai Board helps. Lean is about 2 key activities – surfacing problems and continuous improvement. Any business any system rife with problems – over production, underutilised resources, waiting, inventory, Shrinkage, motion. Transportation, over processing, - Kamishibai is the tool that is used to surface these problems. It’s a; - Simple lean tool to perform audits - Simple yet versatile, flexible and easy to use audit tool - Lot can be achieved in short period of time With hey features being; Can be changed or tweaked – depending on the needs of the business And a very efficient way to surface problems Lean is about 2 key activities – surfacing problems and continuous improvement Any business any system rife with problems – over production, underutilised resources, waiting, inventory, Shrinkage, motion. Transportation, over processing, - Kamishibai is the tool that is used to surface these problems. Kamishibai – often referred to as Control point standards – because you are actually verify that the Standards that you set up are actually being used and in place. Can be used to audit anything and we can it whatever we want – team inspections, Kamishibai – Actual means paper theatre – Japanese word – cards with pictures on one side and writing on the back, used to tell children stories. This morphed into a simple audit structure by replacing the story with questions or whatever, we want to look at … with one side green and one side red… that is easy and quick to deploy. Can be used to check safety, quality, delivery etc. Often referred to as control point standards – looking at the vital processes and making sure that the things are being done the way it should be. *Source – Gembaacademy.com The Kamishibai board designs – we can come up with something that works best for the process or the business. In the spirit of lean, we may want to change it as we find better ways. Teach, train and verify that what needs to happen is actually happening and validate if the processes ae healthy. Supply Chain, Kanban, Lean tools – any of these can be checked via the card structure of kamishibai. It’s a very flexible method – pull the card, read the question on it e.g. do a 5S check in the desk or a workstation nearby. IF everything was fine – the card to be placed with green side out and red side facing in case there was a problem detected. Why use? - Standardisation - Auditing to improve - Simplicity Who can use? Everyone is involved in checking their own work Leaders are involved in checking their processes Who Scope of Checks How Team Member In-process checks Standardize work each cycle Team Leader Team and Zone Check on / Involve team members Group Leader All lines, all zones Check with TLs Area Manager Complete area Involve all levels Plat Manager Site-level, departmental Involve area managers What can be checked? - Standard of work being done - whether people are maintain standards - Proper documentation being done - Whether forms are being completed correctly - Whether Quality checks are happening - Whether the existing forms, SOPs, data etc. are up to date - Whether 5S is being followed - Whether people are working safe, wearing PPE - Checks sheets where applicable are being followed There could many such examples and infact we may want to change or cycle the cards Using the Kamishibai board / Simple Approach Using the card that is relevant to the operations and what is important to the operation The green side and the red side say the same thing – just that green side means ‘ Check completd OK’ and Red side means ‘Abnormilty found’ and surface the problem If all cards are OK, place the card in the board GREEN Side showing *Source – Gembaacademy.com
-
Vishwanath Oleti replied to Vishwadeep Khatri's topic in We ask and you answer! The best answer wins!All projects have timeframes and when it comes to any application development the timeframes are very tight. As the names suggest 'RAPID', the product that’s usable, buildable and billable needs to get out of the door right away. These are like mini projects pulled together into a working prototype. Feedback is received and prototype is refined. How it works; As we work through the process of the application product development, we split up the development and have multiple groups working on it. We pull it together into a prototype, collect feedback, work back through additional incremental and iterating back through to build the particular product. We keep repeating that until all the requirements are met that business is requiring. Below is a typical model for agile software development; Rapid Application Development is a very increment approach. Working through things multiple times and kind of building and making it better. The one thing that separates RAD from other methodologies is that the in addition the components and functions are built in parallel with each other. It starts out with a quick design and then we get into iterations or increments è Demonstrating à Refining à Developing. Creating this prototype and building on this prototype. Once complete, we start with è Testing followed by à Development. The key difference is as shown in the below model; We start out with Analysis and Quick Design. Then we then segment out that particular product into multiple segments such that independent products will talk to each other. Its done with different teams. As displayed in the above model - 1, 2 and 3 are the different project teams or development teams that are working through and looking to solve their segment of requirements with a piece of the product. So everybody is working independently and at the same time everybody is working consecutive together. We ultimately have 3 different projects going to pull together one product. Once everybody has run through together the first iteration or few iterations and deemed a good point, we put all that together in a working prototype. So when we pull those separate project teams all their solutions together, have them work together, talk and build together this prototype then can be show to the business where they can get feedback, they can refine things, they can talk about what they like and what they don’t like, what needs to change, additional features and requirements to be added. And then we work back from the prototype back into the different project teams. So this way we are bouncing back from the prototype as needed to go back and continue iterating through to build out all the necessary features. In the end we would have a working prototype and that is where we ultimately we making it the prototype and turning it into actual production solution that is going to be utilized. It is the final prototype that we use work through the testing and all the different project teams are engaged and then to deployment. So that’s the big difference – we split it up into multiple pieces and then we work on them at the same time…. This allows the product get out of the door much faster, and hence the name RAD where more emphasis on prototyping and less or no emphasis on planning. Though below are the advantages of RAD methodology; - Reduced time to develop - Increased usability of components - Encourages customer feedback - Tackling iterations early avoids later issues However, it would be suitable to follow this methodology if we are being mindful and being able to overcome the below challenges; - Need strong team to identify business requirements - System must be able to modularized - High dependency on modelling skills - Requires highly skilled developers and designers - Availability of a system that can be modularized and completed in 2-3 months - High availability of quality designers for modelling - Large budget available - Resources with high business knowledge available to dedicate to project.
-
Vishwanath Oleti replied to Vishwadeep Khatri's topic in We ask and you answer! The best answer wins!Forecasting is predicting what the future might look like. It is done basis the current information, today’s data and trend analysis. However, what if we that's not the future that we want to be? American computer scientist Alan Curtis Kay once quoted - the best way to predict future is to invent it. i.e. ‘Future’ - is what we really make of it. Which means, for this we need to begin with the future first. Not the future that might be…, but the future that we want to be. The ideal or the desirable future. Planning a desirable future and then work backwards to identify processes and actions needed that connects the future with present - is what Backcasting is. Statistician say that Backcasting s opposite of Forecasting. In Backcasting none of the current information is in consideration. Backcasting is envisioning a future that we want to have (as opposed to growth to where we currently are), deriving the indicators we would see on the way back, and working backwards to adopt the mindsets, behaviors and communication that will help to lead with resilience. Applying ‘Backcasting’ to solve problems:- Using backcasting is very powerful in problem solving or achieving the compelling vision. It prevents us from proposing solutions to problems that we have today. With the end goal in mind we can suggest solutions that will help us create a sustainable future that we want. Once the solutions are proposed, deciding which ones are most strategic while allowing for tactical flexibility. Working backwards. What steps will we take to get there? At some point there will be disconnect between our vision for future and our current path. This tells us where we need to innovate. How will it look when the problems and unsustainable aspects are solved? Identify bottlenecks. Continue to analyze and define the pathways to our vision. For example, I want to solve my obesity problem. I need to religiously follow the below simple steps; 1. Imagine the successful outcome 2. Work backwards from that success 3. Identity steps that would lead to success 4. Make a plan to put those steps into practice Lets say, I would imagine a successful outcome of reducing my weight by 12 kgs. in 6 months. Before I reach the desired bodyweight, I need to demonstrate the required endurance. So, the next step backwards would be to plan of reducing 2 kgs. a month. But to achieve that much of weight reduction, I first need to get accustomed to reducing at a slower pace. So perhaps the next step back is reducing weight by at least 500 gms. per week. This process of working backwards through steps of progression keeps going until I arrive at a realistic first step. For example, I might arrive at the first step of starting with simple exercises followed by tracking and monitor my weight everyday without stopping. This way backcasting would help me plan the steps by working backwards. At its core, the result is common sense. We ask a simple question: “If we want to achieve an outcome, what steps must we take to arrive at that outcome?”

-
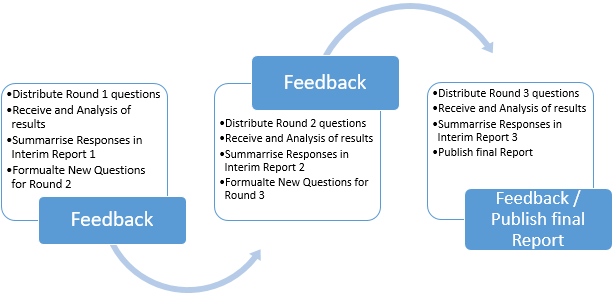
Vishwanath Oleti replied to Vishwadeep Khatri's topic in We ask and you answer! The best answer wins!In a competitive business environment today, business always seek to the expertise advice and appropriate solution to identify and mitigate the business risk. Delphi Technique is a qualitative research technique or also termed as Risk identification tool, originally conceived by Olaf Helmer and Norman Dalkey. It is a participation technique involving iterative process where we try to seek advice and try to incorporate others point of views with the aim of getting subject matter experts to reach consensus. Thus it’s a survey method where we ask the experts series of questions and these experts (may or may not be the project team members) have to share their opinions anonymously. We can evaluate their opinions with the project team. Thus Delphi Technique is a method that allows experts to respond to questions to reach other until reaching agreement on an issue. However, to drive such discussions with the experts, there are 2 key challenges; 1. Experts difficult to have physical meeting 2. Experts might affect by dominant individuals Hence to overcome these challenges, a series of questions delivered to participants via email. This also provides anonymity to participants, thereby encouraging idea generation and reduce dominance by a particular individual. Implementation of Delphi Technique; Although there can be variations on how the method can be applied, there are always certain common distinct characteristics 1. Choose a facilitator 2. Identify and select a group of experts ü The selected participants must be experts in that field and must have great interest. Besides the technique required to form a group of multilateral, they are responsible for giving, collecting, analyzing and summarizing information. 3. Create a list of questions to a problem you trying to solve ü Moderators will need to set questions related to the risks which needs to be identified and these questions are sent to the participants. 4. Send the questions to the experts anonymously. 5. Collect feedback, analyze and compile information. Create another set of questions that will bring all the experts to one point of view. ü The process of Delphi Technique goes through 2 or more sequential rounds. The moderators will monitor, manage, and analyze the feedback along the process. o Round 1. Participants answer the open end questions and submit to the moderators in the specific time given. Moderators need to convert the collected information into well structure questionnaire. o Round 2. Participants receive the questions modified in the first round. In this stage participants required to make a rating of 1 to 10 according to priorities among items. Moderators collect the response, analyze it and make a summary. o Round 3/4. Participants receive the rating summary along with a summary chart. Participants identity the area of agreement and disagreement. Participants are also asked to revise their judgment and specify the reasons for remaining outside the consensus. The responses are analyzed and summarized and feedback to participants for reactions until participants reach an agreement. While Delphi Technique is suitable for small group discussions, discourages domination in decision making process, ranking methods are utilized and enables virtual meetings, the below differences would help us understand and decide when to prefer Delphi Technique over Nominal Group Technique; Delphi Technique Nominal Group Technique The participants of group discussions must have certain level of knowledge towards discussions topic to ensure the quality of idea generated Anyone can be the participants as long as they are involved in the discussions Can be quite slow and time consuming process. Not only slower than face to face meetings but also the time taken to reach consensus takes a longer time as compared to Nominal Group Technique as iterations need to undergo to ensure the best quality of the questionnaire to obtain the best result in identifying risk Time taken to reach consensus is short in order to identify the risk as soon as possible in the discussion after considering everyone’s opinion. There is passive communication as the decision making is on questionnaire results. Anonymity is present to encourage cooperation of the participants in answering questionnaire and to avoid replications among individual panelist Decision making is based on face to face communication. The anonymity does not exist as the identity of the participants is exposed during the discussion.
-
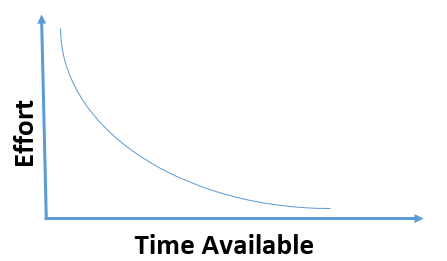
Vishwanath Oleti replied to Vishwadeep Khatri's topic in We ask and you answer! The best answer wins!"Work expands so as to fill the time available for its completion" - British naval historian and author Cyril Northcote Parkinson wrote this opening line for an essay in 1955, but the concept known as 'Parkinson's Law' still lives on today. What the law means that - Work spreads only that much to the extent of time it takes to be completed. i.e. If one year is available, it will take one year, if 1 month is available it will take one month, If one week is available, it will take one week. Time is the most valuable asset. Procrastination (intentionally delaying the actions) is the biggest enemy of success. Parkinson's Law helps us learn how to be more productive with time. Whether we tend to procrastinate or we tend to over analyses – Our time is probably being wasted. The strategy of Parkinson’s law can help quickly complete any task or project. The idea here is that when we give ourselves strict time constraints, we can get more work done in less time. For e.g. If we allow ourselves a week for a task that take only 3 hours, then psychological the task will expand in its complexity and seem more difficult then we will take the entire week. But by trimming the responsibilities down to bare minimum and doing those tasks with maximum efforts, then we would produce high quality work and also free up our time to spend in other areas. Strict deadlines forces us to make things happen. That why its important to estimate how much time each task will take you to complete so that we could use it in the most effective way. The most popular time management approach is time blocking. This approach basically works on Parkinsn’s law. When we are time blocking, we have to allocate time for each activity and that requires to estimate how time each activity will take. What happens when we block time to accomplish a task is – Intention building. Few more points on this approach on how it can be used to improve productivity of a team; · Create tight deadlines · Discourage working late · Use 80/20 rule to the project's/business's advantage · Maintain Time tracker · Make a time limit rule · Discourage/Limit time wasting activities · Encourage team members to take frequent breaks
-
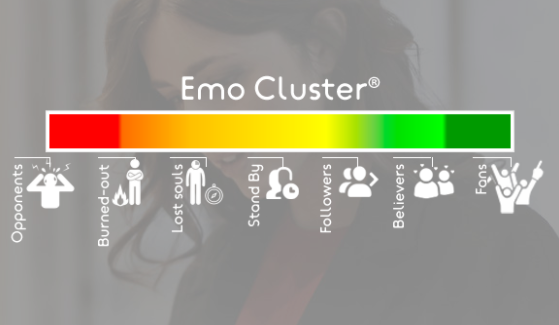
Vishwanath Oleti replied to Vishwadeep Khatri's topic in We ask and you answer! The best answer wins!EMO Index is a tool which helps in measuring the feelings of a customer with regards to any product or services that are sold. It is an alternative to traditional customer satisfaction research. It is a registered trademark of EMO Insights International. Calculation Methodology:- EMO Index is calculated at an individual level. It is a combination of the Net Emotional State (balance of emotions felt) and the Net Intensity Balance (intensity with which they are felt). The measuring values is from -100% to +100%. Customers general emotional states are classified into seven broad categories called as EMO Clusters; 1. Fans (+100 to +80) 2. Believers (+80 to +55) 3. Followers (+55 to +30) 4. Stand By (+30 to +15) 5. Lost Souls (+15 to -5) 6. Burned Out (-5 to -30) 7. Opponents (-100 to -30) Source:- emoinsights.com Leading emotions in the sector is identified and an emotional ranking of brands are made. This also helps is predicting changes and opportunities in the market.