
Topics
-
Jeff Bezos is pushing Prime Video's overhaul to highlight Amazon's AI. The project, known as Lighthouse, aims to showcase AI for millions of users. This initiative seeks to elevate Amazon's standing in the competitive AI landscape. New features will improve content recommendations and respond to spoken requests. Bezos' personal involvement underscores the strategic importance of this AI integration. View the full article
-
Advanced Micro Devices is launching new artificial intelligence hardware on Thursday. This new hardware aims to compete directly with Nvidia's offerings. AMD is targeting the growing data center inference computing market. The company also announced significant deals with AI labs Anthropic and OpenAI. These agreements position AMD for substantial future revenue in the chip sector. View the full article


Leaderboard
-
Johanan Collins
Members2Points72Posts

Popular Content
Showing content with the highest reputation on 01/07/2022 in Posts
-
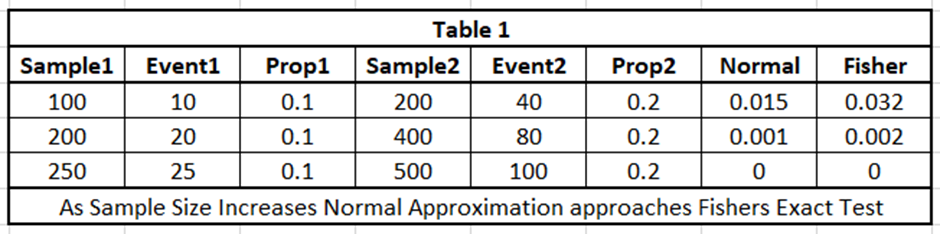
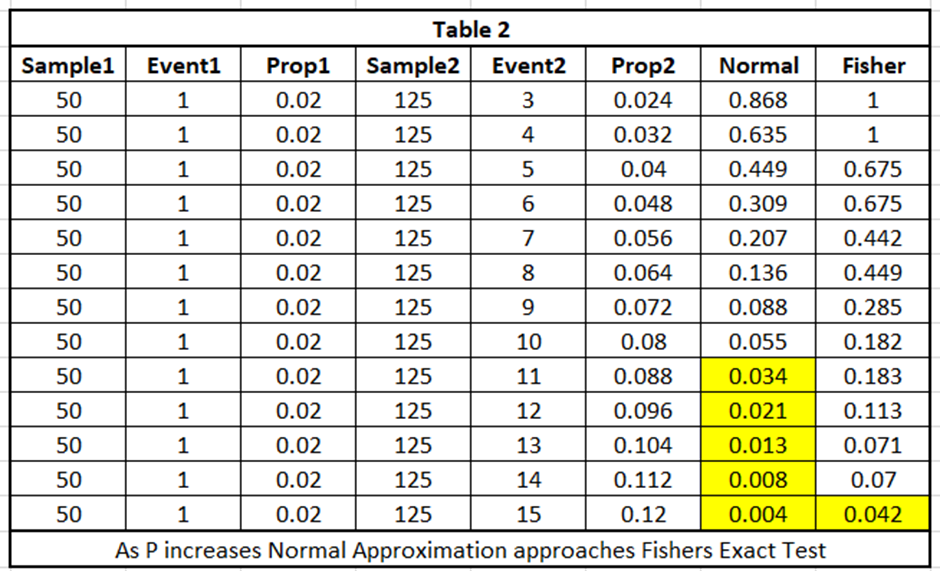
2 pointsA two-proportion test is a hypothesis test to check if the differences between two population proportions are statistically significant. For example, are the proportion of girls to boys in a school significantly different. The null hypothesis is that there is no difference between the population proportions. It can be tested against an alternate hypothesis that can be two-tailed or left/right-tailed. The output of a 2 proportions test has two p-values, one is the normal approximation based on the Z statistic and the other is the Fisher’s Exact Test. As their names indicate, the normal approximation test is an approximation and has greater error for smaller sample sizes and becomes more accurate as the sample size increases whereas the Fisher’s Exact test is always exact irrespective of the sample size however is more difficult to calculate as the sample size increases. The Fisher’s Exact Test is calculated using the hypergeometric distribution. The factorials in the formula make it more and more difficult to calculate the p-value as the sample size increases since it runs every possible combination from the sample, and calculates the total number of successes and failures at that given sample size. It then calculates the p-value from the total successes and failures. Thus, for larger samples, it is not only easier to calculate the p-value using the Normal Approximation Test, but the results are closer to Fisher’s Exact test results. Since we no longer do manual calculations and statistical software have the ability to quickly calculate the p-value from the Fisher’s Exact Test, it makes more sense to use the Fisher’s Exact Test irrespective of the sample size. For a small number of expected values, when compared to the Chi-Square or G-Test of independence, the Fisher’s exact test is more accurate. The Normal Approximation Test (Z-test), is not accurate when the number of events/non-events are < 5. This is based on the rule that N*P or N(1-P) should be >5 (where N is the No. of trials and P is the proportion of successes. In other words, the normal distribution can be used in place of the binomial distribution when the sample size is large. If N is small and P is small, the binomial distribution will be skewed and the normal distribution cannot be taken to represent it. This is evident from Table 1 where N is increased and Table 2 where P is increased. It can be seen from these 2 tables, that as N and P are increased the Normal Approximation approaches the Fisher’s Exact Test. It is also evident from Table 2 that for small samples/P, the Normal Approximation test may indicate that a difference between the population exist when no difference exists. References https://stats.stackexchange.com/questions/234010/2-sample-proportions-z-test-vs-fishers-exact-test https://blog.minitab.com/en/quality-data-analysis-and-statistics/two-p-values-for-a-2-proportions-test-am-i-seeing-double http://www.biostathandbook.com/fishers.html
 2 points
This leaderboard is set to Kolkata/GMT+05:30