suhasini_d
Fraternity Members
-
Joined
-
Last visited
Everything posted by suhasini_d
-
Thanks Mr. Khatri. Best Regards, Suhasini
-
Hi, Could we detect outliers in a set of data using MINITAB? I had been using the reference given in the Online Statistics hand book mentioned in this website which is a little cumbersome. Also please let me know if I'm right in my calculations (please check the Excel sheet). Regards, Dr. Suhasini
-
Dear Mr. Khatri, I used minitab for the normality test and MS Excel for the Correlation graph. I am unable to upload the raw data - I shall send a separate attachment by email. Thanks for the help, Suhasini
-
Thanks for your prompt response Mr. Khatri. Just one clarification: the correlation coefficient of the data (from Excel) is R2 = 0.6773 y = 0.924x + 0.6426 (I had pasted the graph in the word attachment and tried to attach it to the post - the attachment somehow got uploaded separately - could you please check that out? I mentioned ≥ 0.95 in the general manufacturer's sense). So, I presume I could safely infer that POC insrument does not compare well with the lab analyzer? In our publications, one generally mentions 'p-value' after 't-test' - that's what our doctors want in this case. Should I say that t-test is not indicated here or should I go for the Box-Cox transformation (I 'm not sure) and then compare? Regards, Suhasini
-
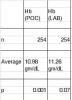
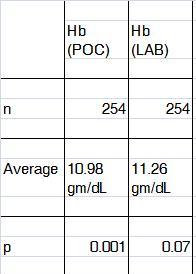
Dear Mr. Khatri, Our ICU doctors have analyzed Hemoglobin values on a POC (Point of care/ bedside) instrument in 254 patients; a sample was sent at the same to the lab. They wanted to know whether the POC values compare well with the Lab analyzer values. Normality test: H0= Data is normal Ha= Data is not normal The results of 2 sample T test: Two Sample T-Test and Confidence Interval Two sample T for Hb (POC) vs Hb (LAB) N Mean StDev SE Mean Hb (POC) 254 10.98 2.58 0.16 Hb (LAB) 254 11.26 2.39 0.15 95% CI for mu Hb (POC) - mu Hb (LAB): ( -0.71, 0.16) T-Test mu Hb (POC) = mu Hb (LAB) (vs not =): T = -1.26 P = 0.21 DF = 506 Both use Pooled StDev = 2.49 Both the instruments appear comparable. In diagnostics, the manufacturers always publish correlation studies of their equipment compared with a standard one - not in the form of t-test but using regression statistics to; the correlation coefficient to be ≥ 0.95. (Please see the attachment for the graph). Though the t-test infers that the results are comparable, the corr. Coeff is not acceptable. Why is this so? Do I need to compare at different levels of hemoglobin? Please advise. Regards, Dr. Suhasini