Adil Khan18
Members
-
Joined
-
Last visited
Everything posted by Adil Khan18
-
Zero Correlation Definition Zero correlations indicating there is no linear relation ship between the compared 2 variables. Could there be situation where correlation is zero? Yes there could be situations where 2 variables can have zero correlation. Examples Salary earned Vs Hair on the Head. Age Vs Nails length Amount of Food eaten Vs Crime rate Bike cost Vs Shoe size Cholesterol level Vs Intelligence Calendar Year Vs Pass Rate Finger size Vs Head shape No: of children Vs Financial Success Blood group Vs Shirt Color
-
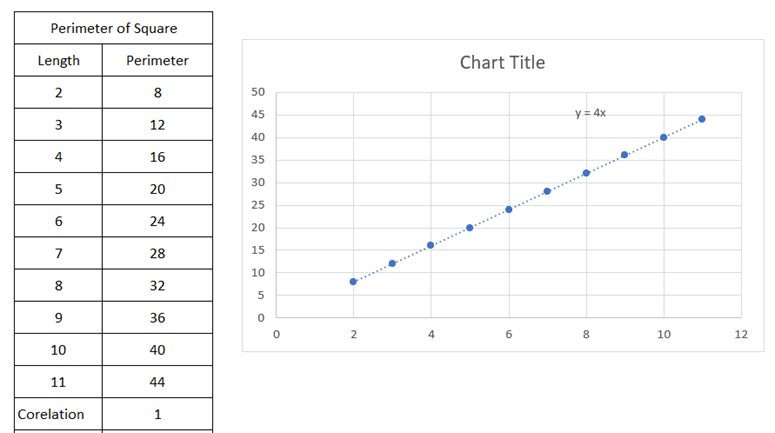
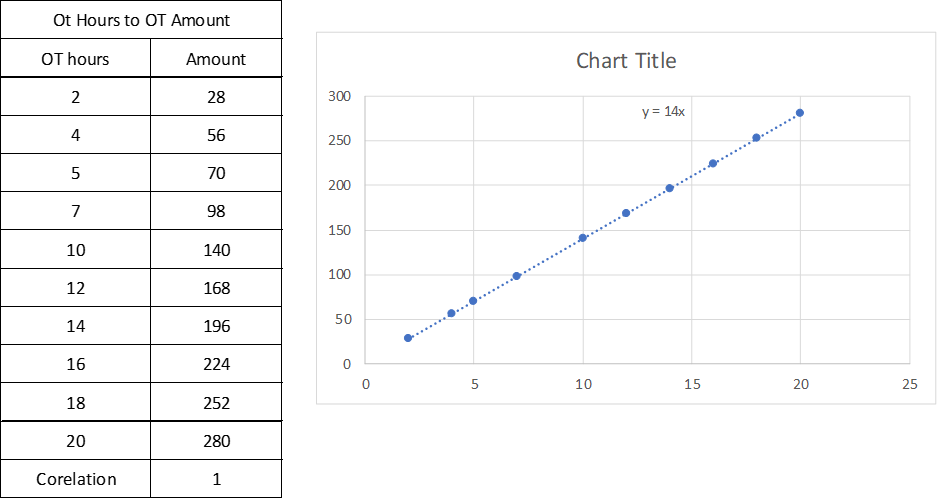
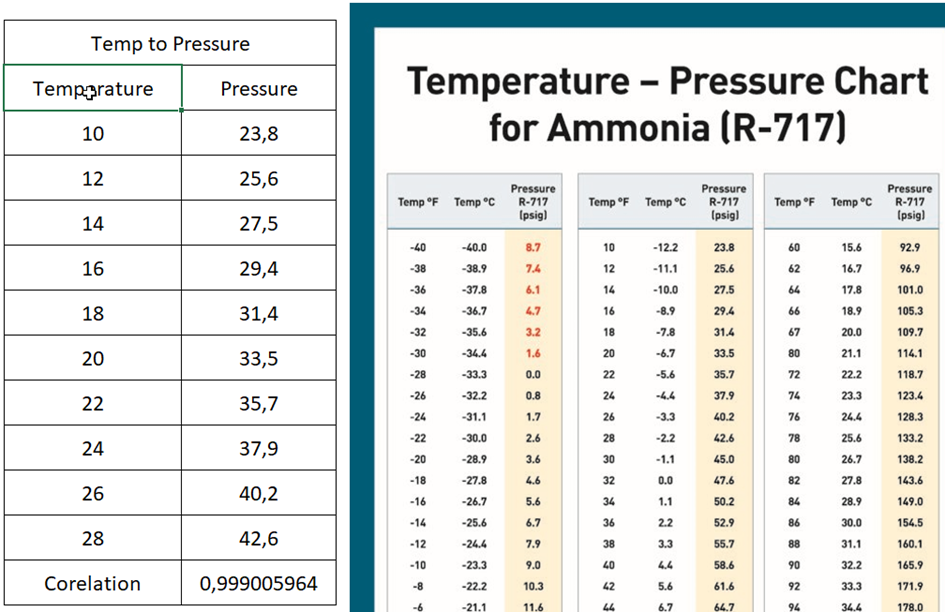
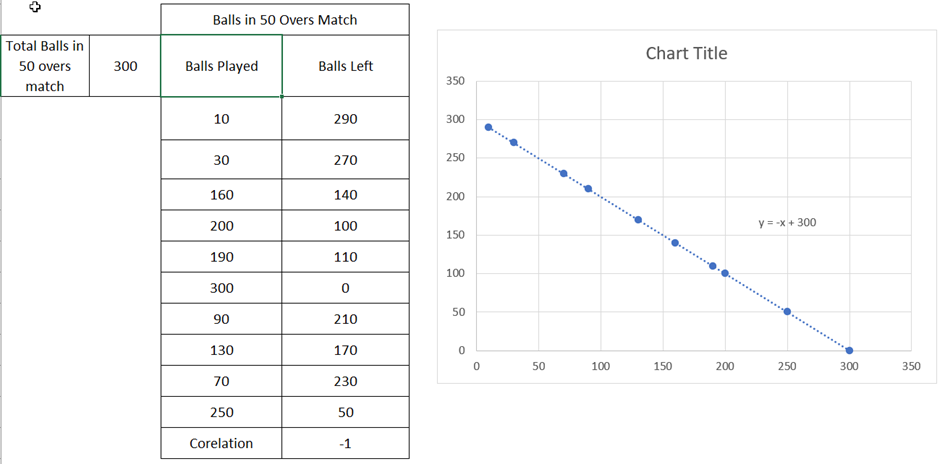
Positive correlation If 2 Parameters are directly proportional (if one increases the other as well increases, if one parameter decreases the other as well decreases) then they are said to have a positive correlation. Example Savings Vs financial security Overtime worked and extra income Salary Vs work satisfaction Increased moisture Vs crop production Perfect positive correlation Perfect positive correlation means that if the first variable moves by some x% then second variable also moves by same amount in the same direction. With the help of one variable we can predict the other variable. Example Length of the square to the perimeter of the square. Radius of the circle to the perimeter of the circle. Over time Hours to Over time Amount Temperature to Pressure Co-relation Negative correlation If 2 Parameters are inversely proportional (if one parameter increases the other decrease or if one parameter decreases the other parameter increases) then they are said to have a negative correlation. Examples Colder the nights in winter and higher the energy bills(gas bill) Higher transportation speed and decreased travel time Increased exercise and fewer medical expenses Higher loan payments and lower total interest amount owed Increased absenteeism and lower overall income Perfect Negative correlation Perfect Negative correlation means that if the first variable moves by say x% then second variable must also move by the same amount in the opposite direction. Nothing more nothing less. With the help of one variable we can predict the other variable. Examples Air Lines Oil Price to Profit Balls left in 50 Over Cricket Match Could there be a situation where it is either -1 or +1 i.e. Perfect Correlation? In theory Yes, its possible (see above examples). In practical its very rare, almost no as there will always be a measurement errors , Instruments uncertainty no matter how accurate your instrument is. Example if you find a perfect square, when you measure length of the square and measure all the lengths for calculating perimeter. You are measuring with say measurement tape there will be always be chance of a measurement error and instrument uncertainty.


-
Make to Order Most commonly referred as Pull manufacturing, no production will start unless you have a Purchase Order(PO) or Sales Order (SO) from customer. You are only producing the part that you actually need and only when it is needed by customer. This is also referred as Just in time(JIT) or Kanban pull system. Advantages 1. Less or no Inventory. 2. When you have to customize your Product for every Customer/Order. 3. Less impacted due to customer design change / Configuration change as you will not have any unusable stock. Disadvantage 1. In Manufacturing sector Raw Material(RM) Lead time is high, if you are only going for Pull system. Getting RM, producing part will increase you Lead time, In manufacturing lead times matter a lot. 2. In sector where demand vary from season to season then in peak season your capacity is not sufficient, in low season you don’t have demand. Example Industries 1. Small Manufacturing companies 2. Automotive (Luxury Cars customized) 3. Textile (Designer wear) Make to Stock Most commonly referred as Push manufacturing, company will produce based on demand Forecast, mostly preferred in industries where there will be low chance of unexpected demand fluctuation. Finished good are produced and stored in ware house or showroom and waiting for customer to purchase the product. Advantages 1. Economic since goods are bought and produced in bulk. 2. As on when and how much to produce is in our control can plan based on historic data to take advantage of seasonal sales. (sales of thermals / sweaters / Over coats high in winter) 3. Quick Response time or lesser lead time as you will have parts / items readily available in stock or ware house. Disadvantages 1. Forecast is so unpredictable 2. Inventory levels will be high 3. Unpredictable customer preferences (size, color, fit, type of cloth) 4. High risk of Shortages or excess of items Example Industries 1. Raw material provider (Mil) 2. Fast moving Consumer Goods (FMCG) 3. Commercial Of The Self (COTS) items. 4. Beverages 5. Pharma 6. Food items Which of the two approaches is better? One cannot say a particular system is better, both the systems suit different industries. it varies from industry to industry. A system which is world class in one industry is a loss making system in other industry. Which system suits your industry depends on how you operate and how is the market behavior. In modern days most companies prefer being a Hybrid instead of following a particular system. They implement make to stock at the middle of the process system so can respond to the customer demand and do the customization as needed. There ability to respond to customer order and have products available when customer wants them, without getting struck with piles of inventory which can never be sold. Example:- 1. Mc Donald’s / KFC :- They maintain stock of bun's, hams, onions ready as they receive the order they make the final customization. 2. Manufacturing Industries :- They buy Raw material and keep in stock as on when they receive the Order they produce the part and ship to customer. 3. Textile Industry :- Does production of Fabric in raw form and keep in stock, once receiving order customization of color, size are done and sent to showroom. 4. Zara Company :- Zara doesn’t work on the number of finished clothes but on the quantity of raw materials needed to manufacture the clothes. This helps to reduce waste, as you can re-use fabric but not resell a piece of clothing that no one wants to buy. Final Summary The Key difference between push and pull manufacturing is in a push system, company decides how much of the product will reach the market while in a pull system, Customer demand though order dictates how much to produce. Make to Order Make to Stock Pull Type manufacturing Push Type manufacturing Parts are produced after receiving the PO or Order Parts are produced based on stock (Min Stock Qty) or Market forecast (based on historic data) Not depended on assumptions as we have firm PO Based on Assumptions (Market demand, Forecast) No Fluctuation as in PO or Sales order Qty is rigid High fluctuations as Qty is based on unreliable assumptions. Forecast is unpredictable. Low Inventory High Inventory Delivery time High Delivery Time Low Cost of final product High Cost of Final Product relatively low as you are buying and producing in bulk. Wastage will be less Wastage can be High No risk of Shortages or excess High risk of Shortages or excess
-
Cp, Cpk, Pp & Ppk are used to see if the process is capable. This concept was widely used in Automobile industry as they had series production (600-700 child parts in day) with functional critical & significant characteristics they realized blindly cannot rely on just 100% Inspection of parts. 100% inspection of all the parts and all the dimensions is not practical for them as numbers were big. So they needed a way to get away with sampling inspection. Cp = A Capability index, Compares the process variation to the maximum allowable variation as indicated by the tolerance. Process variation is derived from within the subgroup range (Sometimes called as short term process capability). Cp Does not consider process location. Calculated as follows Cp = USL-LSL / 6 Sigma Where Sigma = R/D2 R = Mean of all the ranges of each sub group n = number of samples D2 = Statistical Constant used in the estimation of Standard deviation from ranges USL / LSL = Upper and Lower Specification Limits X = mean of n Samples Cpk: A Capability Index, Takes into account process location as well as process variation. Process Variation is derived from the within subgroup range (Sometimes called as short term process capability). Cpk = Minimum [(USL - X) / 3Sigma, (X - LSL) / 3Sigma] Pp = A Process Performance index. Compares the process variation to the maximum allowable variation as indicated by the tolerance. Process variation is derived from process standard deviation (Sometimes referred as overall or long term process capability). Pp does not consider process Location. Pp = USL-LSL / 6 Sigma Where Sigma = Standard deviation Ppk : A Process Performance index, Takes into account process location as well as process variation. Process Variation is derived from the process standard deviation (Sometimes referred as overall or long term process capability) Ppk = Minimum [(USL - X) / 3Sigma, (X - LSL) / 3Sigma] Note : a. if you are planning of performing Cp Cpk or Pp Ppk studies, first ensure that MSA has been performed and your measurement system is reliable. Otherwise what ever you do will be of no use. b. Cpk can never be greater than Cp due to its formulae. In ideal case scenario Cp will be equal to Cpk. c. If sub group sample size is 1 then there will not be cp and Cpk values (eg: continuous produced parts) you will have only Pp and Ppk. In Automobile Industry few customers mandate six pack process capability (refer below image) to accept as process is capable during PPAP stage. Only when 6 pack process capability is met, then approval is provided to go for series production. Final Summary Formulae is same for Cp and Pp, Cpk and Ppk calculation, only difference lies in how standard deviation is calculated. For Cp, Cpk standard deviation is calculated by using within Sub group range. While Pp and Ppk standard deviation is calculated using overall standard deviation. If data is collected at systematic intervals say first 2 parts of every Shift, key dimensions checked in CMM then checking Cp Cpk is preferable. If continuous serialized produced parts (1-30) data is being used then checking Pp, Ppk is preferable. It basically depends on how the data is selected. While doing DMAIC which capability studies can be used. My Opinion Cp Cpk a. If data has been systematically time based picked say once in every hour, 5 parts picked. b. When you have sub group and sample size is >1. c. When using historic data say data captured for first and last part inspection at the beginning of every shift and with that data you want to check process capability. Pp Ppk a. When you do not have historical data all you have is the data that you have produced now. b. When sub group sample size is 1 c. When data is of parts from continuous production (eg: serial 1-50)

-
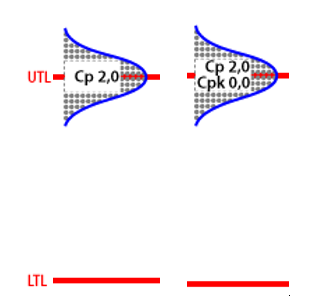
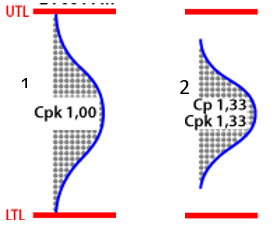
The Reason why we need to consider both Cp & Cpk or Pp & Ppk is, only then we get the complete picture where we need to actually work on to reach the targeted process capability targets. Cp (Capability Index) or Pp (Process Performance Index) compares the process variation to the maximum allowable variation as indicated by the tolerance. Cp or Pp does not consider the process location. Example If we look only at Cp or Pp and do not keep a eye on Cpk or Ppk it can deceive us. (See below Image) after looking at Cp is 2.0 you may think say its world class process, is it really? Only When you see both Cp & Cpk or Pp & Ppk you realize how your process actually is. Cp or Pp = USL-LSL / 6Sigma (sigma = Standard Deviation) Cpk (Capability Index) or Ppk (Process Performance Index) takes into account process location as well as process variation is derived from within subgroup range for Cpk and for Ppk it is derived from overall standard deviation. Cpk or Ppk = Minimum [(USL - Process Mean)/ 3Sigma, (Process Mean - LSL)/3Sigma] Example Look at below image (only the one marked with 1 ) if you have only Ppk or Cpk, you now know your process is centered but you dont know if it is capable. If your boss says lets make our process Ppk or Cpk = 1.67 what can you do make it even more centered? Only when you look at Cp as well as Cpk you get the complete picture. If we have both Cp & Cpk or Pp & Ppk we can decide what has to be done to make our process more capable. If Cp has to be improved then process variation must be reduced and if Cpk has to be improved then process dimension must be centered.