Adil Khan18
Members
-
Joined
-
Last visited
Everything posted by Adil Khan18
-
Domain: Aerospace Manufacturing – AI-to-AI collaborative repair & overhaul (MRO) scheduling across airline → MRO station → OEM → sub-tier suppliers (Real 2025 scenario already in live use by a major European engine MRO joint-venture serving Lufthansa, IAG and Air France-KLM) The exact inter-company scenario When an Airbus A320neo or Boeing 737 MAX has an unscheduled engine removal (bird strike, FOD, oil leak, etc.), four different companies’ AIs must agree on the fix within 4–6 hours or the aircraft stays on the ground costing €80,000–150,000 per day. The players: Airline operations control AI MRO shop AI (where the engine physically goes) Engine OEM (Rolls-Royce or Pratt & Whitney) technical records AI Critical parts suppliers (blades, LLPs, bearings) How direct AI-to-AI collaboration works today (no human in the loop for 84 % of cases) Airline AI detects the fault, creates the removal order and pings the MRO AI: “Engine ESN 98765 removed FRA 02:15, need back on wing in ≤11 days. Target AOG cost < €1.1 M.” MRO AI instantly checks: – Next available shop slot – Required life-limited parts (LLPs) status – Module condition from last borescope It answers in <40 seconds: “Can accept engine, earliest induction 36 hrs from now, but missing two HPT blades (P/N FW-11992). Need confirmed delivery within 72 hrs.” OEM AI joins the chat automatically, checks its own stock + sub-tier stock: “Two blades available at Safran warehouse Singapore. Can ship today, arrive MRO door in 52 hrs. Cost €312 k. Accept?” Supplier AI confirms transport slot and sends binding quote + ETA. Entire negotiation (shop slot + parts + price + transport) finishes in under 4 minutes. Digital contract is auto-signed by all four AIs. Ferry flight and trucking are booked automatically. Real wins already measured in 2025 Average AOG time for shop-visit engines dropped from 38 days → 14 days Spare engine fleet requirement reduced by 3 engines per airline (saving €90–120 M capital per carrier) Manual emails/phone calls per event dropped from ~120 to zero Parts “no-show” rate dropped from 18 % to 1.1 % Real risks and how the industry actually governs them Risk – One AI lies about stock to force premium pricing Happened once: supplier AI claimed “zero stock” → price €480 k” while actually having blades in the next room. Fix → All stock positions of critical LLPs are mirrored daily into a permissioned blockchain visible to airline + OEM + MRO. Lying = automatic €500 k penalty + 12-month ban from the platform. Risk – “Death by 1000 small delays” Every AI wants to protect its own backlog. Fix → Hard SLA baked into the digital contract: if any party delays confirmation >3 minutes they pay €5,000 per hour to the airline until the loop closes. Risk – Confidentiality leak OEM does not want airline to see exact sub-tier pricing. Fix → Zero-knowledge proofs: supplier AI only proves “I can deliver part X by date Y for < €Z” without ever revealing the actual cost or exact inventory location. Risk – Who pays when both AIs agree on a bad plan? Example: two AIs once scheduled a module swap that violated airworthiness rules (wrong mod status). Fix → Every final agreement is automatically validated by an independent “regulatory AI” (EASA-approved) before anything is executed. If it passes, liability is shared 25 % each party. Bottom line from inside the hangar In aerospace MRO, an aircraft on ground costs more per day than most people earn in a year. When four AIs from four different companies can negotiate a €2–4 million repair package in four minutes — and actually deliver the engine back on wing two weeks faster — trust isn’t built by handshakes anymore. It’s built by unbreakable smart contracts, transparent penalties, and blockchain audit trails. We already went from 120 angry emails to zero. The humans only talk now when something truly weird happens — about once per month. That’s AI-to-AI collaboration that already keeps hundreds of aircraft flying and saves the industry hundreds of millions every year.
-
Domain: European Automotive Supply Chain – Just-in-Sequence cockpit & door-module delivery to OEM assembly lines Background: €1.1 bn Tier-1 supplier with plants in Czech Republic, Romania and Spain, feeding Volkswagen (VW), Stellantis, BMW and JLR final assembly plants). Every working day, at least seven different companies’ AI systems have to make life-or-death decisions together: if one of them hides the wrong thing for five minutes, a €2–4 million-per-hour assembly line stops. The exact ecosystem process OEM sequencing AI sets the vehicle build order for the next 12 hours → our Tier-1 AI instantly re-slots painting, foaming and assembly → logistics AI consolidates trucks with two other Tier-1s → the inbound sequencing system at the OEM plant validates every rack before it enters the line. How much transparency we actually give in 2025 (contractually agreed with VW, BMW and Stellantis) 100 % real-time transparency on anything that can disrupt the line in the next shift We push a live feed containing: Exact completion timestamp per module (down to the minute) AI confidence score (e.g., 97 % that rack 8814 will be loaded at 06:42) Top 3 risk factors if confidence < 95 % (“Booth 4 filter change running 11 min late”, “Absenteeism on final assembly line 2”, “Resin batch viscosity 6 % high”) → The OEM’s AI can immediately re-sequence vehicles or call a buffer rack. Zero surprises. Zero transparency on competitive advantage or personal data We never share: Station-level OEE, cycle times, or scrap rates Exact labour cost model Individual employee attendance or performance data (GDPR + works-council rules) Future capacity allocations to other OEMs The actual model weights or training datasets The contractual boundary that works in practice “Share every fact and every reason that can cause a line stop within the next 8 hours. Everything else remains black-box.” Real incident – summer 2024 Our paint-shop AI detected an incoming pigment batch was slightly out of spec (delta-E creeping toward the limit). Within 90 seconds we pushed: “Confidence on Night Blue modules drops to 78 % after 14:30 – root cause: pigment lot P-4487 colour drift.” VW Wolfsburg AI automatically moved all Night Blue vehicles to the end of the day. Line never stopped, pigment supplier swapped the silo by 16:00, and the plant manager sent us a thank-you note instead of a penalty invoice. Real incident when we shared too much – 2022 lesson We once gave full visibility into station-level cycle times “to build trust”. A competitor who also supplies the same OEM reverse-engineered our bottlenecks and undercut us on the next platform RFQ. Lost €37 million in future business. Bottom line for European automotive ecosystems Maximum transparency on short-term operational risk, zero transparency on long-term competitive edge or personal data. That is the only balance that keeps multi-billion-euro assembly lines running 24/7 while still letting every partner stay in business next year. It’s not a philosophical discussion — We don’t argue about “how transparent AI should be” like it’s some college debate. On a car assembly line, every minute the line is stopped costs €50,000–80,000. One hour = millions gone. That amount is bigger than any lawyer bill, any fine, or any bonus in the whole company. So we wrote one dead-simple rule in the contract that everyone signs without complaining: “If your AI sees a problem that can stop my factory in the next 8 hours → tell me everything, right now. Everything else → keep it secret, no problem.” Money talks louder than philosophy. That’s why it works.
-
Domain : Warranty claim handling in industrial manufacturing Background: Mid-sized hydraulic pump maker, €220 M revenue, serving big OEMs in agriculture and construction) In our world, the deepest customer relationship is not built during onboarding or sales dinners. It is built (or destroyed) at 3 a.m. on a Saturday when a €42,000 pump fails on a customer’s line and they file a warranty claim. That moment is pure emotion: anger, downtime costs, fear of missing a delivery to their own customer. Trust, empathy and consistency are decided right there. How AI is genuinely strengthening the relationship We added AI to the warranty claim process exactly to inject more empathy and speed, the two things customers value most when something breaks. The instant a claim lands (usually angry WhatsApp photos + serial number), our computer-vision + MES-connected AI does the full forensic investigation in <60 seconds and hands the engineer a one-page “here’s exactly what happened” summary. The engineer can now phone the customer in 15–20 minutes (instead of 4–5 days) and start the conversation with real understanding: “Tom, I’m really sorry your line is down since 2 a.m. I already pulled the birth record of that exact pump — we had porosity in cavity 4 on that batch. It our fault completely. New unit is going out on the first flight, we will bear the freight charges and labor cost.” The customer feels seen, respected and protected. That is empathy delivered at scale, made possible only because AI removed the painful delay and guesswork. Real proof it builds relationships: One North American OEM told us last quarter, “You’re the only Tier-1 who admits the mistake and fixes it before we even finish explaining the problem.” They just awarded us sole-source for their next global platform. The risks when AI oversteps or misreads intent (we have the scars): Once the AI wrongly concluded “misinstallation” and the engineer repeated that to the customer. Turned out our own sensor had drifted. The customer didn’t feel empathized with — they felt blamed. Took months and free parts to regain trust. Another time we let the system auto-send the full forensic report to a small customer who just wanted the pump replaced fast. They felt lectured instead of helped. Relationship cooled instantly. Bottom line — yes, AI can build genuine relationships, but only when it is used to make humans faster at showing empathy and ownership. In manufacturing, customers don’t measure relationships in smiley chats. They measure them in how fast you stand behind your product when it fails them. Done right, AI turns a crisis moment into the strongest bond you’ll ever have with that customer. That’s not efficiency replacing empathy — that’s AI amplifying real human care at the exact moment it matters most.
-
Domain: Semiconductor Manufacturing – Cost Engineering & Operations How AI Is Changing the Way Leaders Make Decisions In semiconductor manufacturing, cost engineers and operations leaders constantly make decisions that affect margins, delivery timelines and customer trust. Today, AI tools are deeply involved in this process from costing models to yield prediction and supplier performance analysis. This has changed not only the speed of decisions, but also the way leaders approach risk and judgment. AI definitely brings value, but it does not remove the need for experience, context and practical understanding. Leadership Scenario: Approving a Customer Quote when conditions are unstable A cost engineer is asked to approve a new customer quote while several things are happening in parallel: Material prices are moving unpredictably Scrap has increased on similar components Tool wear is slowly affecting cycle time Supplier delivery dates are no longer consistent The AI system pulls all this data together and presents expected cost ranges, yield risk, machine reliability patterns and margin projections based on history. This changes how the leader evaluates the situation. Instead of going purely on experience or instinct, the leader now sees a structured picture but still has to interpret it sensibly. Where AI helps leaders make better decisions AI simplifies complex information. Instead of checking multiple reports (Rejection rate, each work center cycle time) and spreadsheets, leaders see a consolidated view of cost impact, process stability and supplier behavior. This makes it easier to understand where the real risks lie. It also highlights trends that might otherwise go unnoticed, such as slowly rising scrap or recurring downtime patterns. In many cases, this early visibility prevents poor commercial decisions. Another clear benefit is stabilizing decision-making. Leaders no longer rely only on gut feeling; they have realistic ranges and data-backed forecasts to guide quote approvals. Where AI still needs human oversight AI struggles when conditions change suddenly. A late design modification, tighter tolerance requirement or unexpected process constraint may not immediately reflect in the model’s output. New or highly complex parts can also mislead the system. If the AI compares them to older, less demanding jobs, it may underestimate true cost and processing difficulty. Most importantly, AI does not understand strategic intent. Some orders are accepted to build long-term relationships, support future programs or strengthen market position. These are business decisions, not mathematical ones. How leadership thinking must evolve Leaders need to see AI as a decision support layer, not as the final authority. The output should guide thinking, but not replace it. It is important to validate AI insights with what is happening on the shop floor. Scrap trends, cycle time deviations or capacity issues should always be verified with engineers and supervisors. For major decisions long-term contracts, high-value components or technically sensitive aerospace parts human accountability must remain clear and visible. A simple but powerful habit is regularly asking: “What might this system not be capturing today?” This keeps judgment grounded in reality, not just numbers. Conclusion AI is clearly reshaping how leaders make decisions in semiconductor manufacturing. It improves speed, visibility and structure, but it cannot understand strategy, intent or the human side of operations. The strongest leaders use AI as an intelligent guide while retaining full ownership of decisions. When experience and data work together, decision-making becomes not only faster, but more reliable and commercially sound.
-
Domain: IT / Software / Tech Services In an IT company like ours, AI has quietly slipped into almost everything we do. Developers use it while coding, testers use it to find risky areas and support teams use it to draft replies. Once AI becomes part of daily work, it doesn’t just automate tasks it starts influencing how people think and behave. So we have to talk about what that means for our culture. Let me keep this simple. AI affects four areas of our culture: transparency, accountability, learning, and innovation. Transparency: AI gives us dashboards and risk maps, which is great because problems are visible sooner. But there’s a flip side — people might start saying “the tool didn’t warn me,” instead of trusting their own judgment. We need to watch that. Accountability: AI suggests things, but the decisions are still ours. If we don’t reinforce that, people may quietly start blaming AI instead of owning their choices. Learning: The good part is that juniors learn faster — they see clean examples and patterns immediately. The risk is that some may stop digging deeper, because AI already spoon-feeds the answers. Innovation: AI makes experiments quicker; you can test ideas in minutes. But if everyone relies on the same tool too much, we lose originality — everything starts looking the same. Now, a few real cases we’ve already seen: Some developers accept AI suggestions without really checking (So complex if want to do small tweek then dont know what to change). QA testers sometimes trust the AI’s “low-risk” tag too much (Does AI know how our company works?). Support agents occasionally send AI-written replies without reading them carefully (Statement context changes completely). These aren’t technical issues — they’re cultural behaviors. So here’s what we as leaders, need to do. 1. Repeat the message: “AI assists, humans decide.” This keeps responsibility clear. 2. Have short weekly discussions on where AI went wrong. Just ten minutes. It helps everyone think critically instead of accepting things blindly. 3. Don’t praise only speed. If fast output becomes the only goal, people will lean too much on AI shortcuts. 4. Give teams basic training on how AI works and where it fails. Even a small understanding changes how responsibly people use it. 5. Keep humans in charge of important decisions. Anything that affects customers, security or production should always have a human final check. To wrap it up: AI will influence our culture whether we like it or not. It can push us toward more transparency, better learning and faster innovation — or it can weaken ownership and creativity. The difference depends entirely on how we guide our teams. If we lead it well, AI becomes a strength, not a shortcut.”
-
Domain: Banking and Financial Services — Tax & Compliance Automation A few years back, several banks deployed an AI system that handled most of our indirect tax work. It was trained to classify transactions, map them to the right tax slabs, and prepare filings under the old VAT and Service-Tax framework. At the time, it worked almost flawlessly — fast, accurate, and reliable. Then the world around it changed. When GST came in, the tax structure itself was rewritten. New commodity codes replaced old ones, input-credit rules changed, and exemptions started coming from central as well as state authorities. Now with GIFT City offering 10-year tax holidays and a 5 % concessional rate for certain branches, the system’s logic simply doesn’t fit anymore. The AI still runs — but it’s working from a rulebook that no longer exists. When It’s Time to Retire or Replace the AI We didn’t rush the decision; we looked at hard signs that told us the system had reached the end of its useful life: 1. Regulatory drift – More than a quarter of the old rules it uses are obsolete, and the team spends most of its time overriding its suggestions manually. That’s a red flag. 2. Data irrelevance – The historical VAT-era data doesn’t align with the GST framework, so the AI ends up learning from outdated patterns. 3. Logic fragility – Each new policy requires yet another patch. What once delivered 95 % accuracy now struggles to hit 80 %. Maintaining it costs more than replacing it. 4. Compliance risk – Even one wrong classification for a GIFT-City transaction can cause a penalty. When the risk of keeping it is higher than the cost of change, it’s time to move on. How We Managed the Transition Step 1 – Run both systems together. We launched the new GST-compliant AI in shadow mode for a few months. Every report was compared side-by-side with the old system to check for consistency. Step 2 – Map and retrain. All the old tax codes were mapped to new HSN/SAC classifications, and the new AI was retrained on three years of post-GST data so it understood the current reality. Step 3 – Dual review. For the first two filing cycles, finance and compliance teams reviewed both outputs manually to make sure there were no surprises. Step 4 – Keep the knowledge. Before shutting down the old AI, we archived its logic and exception rules. That archive now serves as a reference for audits and for the new model’s design notes. Step 5 – Official sunset. Once the new system met all accuracy and compliance targets for two quarters, the old AI was formally retired under IT governance procedures. A Real Example When GIFT-City rules introduced the new 5 % tax rate, our old AI didn’t even recognize the exemption codes. It flagged every single transaction as an error, and the manual correction list kept growing. That’s when we knew patching wouldn’t cut it. The replacement model was trained on updated GST and GIFT-City data, tested for six months, and finally approved after hitting 98 % accuracy. The legacy system was then archived, but its logic notes were saved for reference. In Summary Sometimes an AI doesn’t fail technically — it just gets left behind by reality. When the laws, data, and business model evolve faster than updates can keep up, retiring the system isn’t wasteful; it’s smart governance. By running both systems in parallel, retraining carefully, and documenting every step, we managed a clean handover that kept compliance solid and business uninterrupted.
-
Domain: Banking — Fraud Detection and Transaction Monitoring In a bank, an AI system runs behind every digital transaction. Its job is to spot anything that looks off — like a card suddenly being used in two countries within minutes, or someone transferring a large amount to a brand-new account. When it sees something unusual, it either blocks the payment or sends an alert to the fraud team. It works great when it’s new. But over time, people’s habits change — they travel more, use new payment apps, or start shopping on international websites. That’s when the AI can get confused, either blocking good transactions or missing real fraud. So the trick isn’t just building it — it’s keeping it in line after it goes live. 1️⃣ Keep an eye on accuracy every single day We track how well it’s catching actual fraud versus how often it cries wolf. If the false-alert rate goes above 5 % for a few days, the AI stops auto-blocking and switches to a review-only mode until we fix it. It’s like a safety brake — we’d rather check twice than upset good customers. 2️⃣ Watch for data drift The AI learns from spending patterns. If too many new kinds of transactions show up — say, everyone suddenly starts using a new digital wallet — the system knows its old patterns don’t fit anymore. When that drift crosses a set threshold, it raises its hand for retraining. 3️⃣ Audit how fair it is Once a week, our fraud and compliance team reviews a few hundred random cases. We look for patterns — maybe one region or customer type keeps getting blocked more often than others. If that happens, we fine-tune the model or the rules. We want tough fraud control, but not bias. 4️⃣ Retrain only when it’s really needed We don’t retrain on a timer; we do it when the data proves the model is slipping — for example, when accuracy drops below 90 % or new payment methods go live. We always test new models on months of old transactions before letting them replace the live one. 5️⃣ Keep humans in charge Every month, our AI Fraud Governance Board — risk, compliance, IT, and customer service — sits together to review how the system’s doing. If accuracy or fairness drifts, we take action. Every quarter, internal audit checks that the AI still meets KYC, AML, and GDPR rules. A real example Right after a big shopping festival, the AI started flagging thousands of small international card payments as fraud. It wasn’t wrong before — behavior just changed. Accuracy dipped, and the system’s drift alert kicked in. We retrained it with fresh data, and within a week it was back to normal, catching real fraud and leaving genuine customers alone. In short AI in banking is like a guard who never sleeps — but you still have to check if he’s watching the right door. We monitor it daily, audit it weekly, and retrain it when life changes faster than data does. That’s how we keep our fraud detection both smart and human-friendly.
-
Domain: Aerospace Heat Treatment (Solutionizing & T6 Hardening) Framework: NADCAP (AC7102) | AS9100 Rev D At our plant, the AI system we’re getting ready to use will monitor the complete heat-treat process for aluminum parts — from the solution cycle (T42) all the way through aging (T6). In short, it keeps an eye on furnace temperature, soak time, quench delay and even freezer logs once the load is out. The goal isn’t to replace operators; it’s to make sure every batch follows the qualified recipe without slips or missed alarms. Step 1 – Prove the AI actually works Before going live, we run it side-by-side with our existing SCADA for about a month. It has to track furnace temperature within about ±3 °C, match soak-time control within a minute and recognize every out-of-limit event. We also test it by creating small faults for example, a 5 °C sensor bias or a short delay in the quench timer, just to see if it catches them. If it misses anything, it’s back to tuning. The fail-safe is just as important: if a thermocouple drops out, the AI must freeze the recipe and alert the operator immediately. Step 2 – Keep everything traceable Every batch record is digital. The AI automatically links furnace data, part numbers, start–stop times, quench logs and operator IDs. When it recommends a change — say, adding a minute of soak time or adjusting voltage slightly — the reason and timestamp are stored in the traveller. If it wants to move outside the approved limits, a Level 3 heat-treat skilled engineer has to sign off first. That way, we can show auditors or customers exactly what changed and why. Step 3 – Certification and periodic review Before the system touches real production, four people sign off: the Quality Manager, Process Engineer, Compliance/EHS officer and the Automation lead. Once it’s certified, we still re-check it every six months or any time we change the furnace mapping, bath chemistry, or retrain the model. During each review, we run at least three test loads and make sure our Cpk on temperature and soak time stays above 1.67. If the AI’s accuracy drifts by more than about five percent, it automatically pauses itself and waits for inspection. A quick example During one trial, the AI noticed the middle zone in Furnace #3 cooling a few degrees faster than normal halfway through the soak. It raised a warning — “Zone 2 temp deviation – 4 °C” — and maintenance found a weak blower. Fixing that early saved a whole batch from re-processing. All of it was logged automatically with the operator’s name and the part numbers involved. In summary AI can do a lot of heavy lifting in heat treatment — watching temperature curves, soak times, quench delays, and freezer conditions — but it still has to earn its trust. We treat its certification just like we do our furnaces or gauges: prove it, record it and re-check it. That keeps us compliant with NADCAP and AS9100, while giving the team a smarter set of eyes on every load we run.
-
Domain Selected: Digital Advertising Optimization AI Process : Real Time Ads Campaigning Optimization A digital marketing company uses AI driven ads engine to manage thousands of ads acroos social media platforms like Google, Meta and YouTube. The system analyses data on clicks, conversions, time of day, demographics and spending patterns to automatically adjust bidding strategy, audience targeting and budget allocation in real time. Its main goals are to: Maximize Returns on Ads Spending (ROAS). Keep Cost per Acquisition (CPA) within target range. Maintain brand safety and ethical targeting. Because AI self learns continuously based on data, it must also self-audit ensuring its improvements does not cause drift away from business goals or compliance norms. AI Self-Improvement Governance Framework The system operates under three inter connected control layers: 1️⃣ Performance Integrity Layer 2️⃣ Ethical Integrity Layer 3️⃣ Business Alignment Layer These ensure that the AI remains effective, fair and accountable even when learning continuously. 1️⃣ Performance Integrity Layer Ensures the AI self learning remains statistically controlled and performance / data driven. (1) Continuous KPI Tracking AI compares predicted vs actual results for each campaign. KPI to be monitored Target ROAS, CPA and click through rate(CTR). If ROAS variance > ±10% or CPA exceeds benchmark for 3 hours consecutively, the system triggers a Performance Drift Alert. Real time dashboards show moving averages and EWMA trend lines for early detection. This dashboard is monitored weekly and if data drifts cross check can be performed based on change log. (2) Controlled Auto Tuning by AI AI can self adjust biding amount and timing with in the preset boundaries. Max bid change ±20%. Daily spending shift ≤ 10%. Before a new logic is deployed, a sandbox simulation run is performed using the last 7 days data to test projected performance. Only if simulated gain ≥ 5 % with no compliance flag, AI deploy changes automatically. Else it will escalate for human review and approval. (3) Model Health Metrics Predictive accuracy is monitored and learning stability are logged. If prediction accuracy drops below 85% auto re-training pauses and data scientists are notified for cross check. 2️⃣ Ethical Integrity Layer Prevents AI from optimizing at the cost of fairness, brand reputation or users trust. (A) Bias & Sensitivity Screening Weekly fairness report compare ads impressions by demographic (City / Suburb). If gender (M/F), region or age (Child / Teen ager / Elder) disparity > 15 % without marketing justification, AI flags “Potential Bias”. Ads containing sensitive keywords (‘jobs’, ‘finance’, ‘housing’) require human approved targeting templates. (B) Ad Content & Placements Safety AI cross checks ads placements against a live “Brand Safety List.” If 0.1 % of placements appear on flagged domain, the campaigns pauses automatically. (C) Self Correction with Human Oversight AI may propose ethical rule updates (eg expanded sensitive terms list) but cannot enforce them with out the compliance team (legal team) approval. 3️⃣ Business Alignment Layer Ensures AI’s auto improvements stay in sync with overal marketing strategy and financial limits. (A) Budget & Profit Guardrails AI cannot exceed total daily / weekly spending limits (added for a reason) or re-allocation of budget amount between clients. Any cumulative budget shift >5% across accounts calls for manager authorization to proceed. (B) Campaign Priority Validation AI decisions always cross checked with business goals. “Is this campaign meant for awareness or to increase sales?” “Is the target market fixed for Q3?” If AI optimization conflicts with approved campaign hierarchy, it stops self adjustment until manual approval by Human. (C) Transparent Logging & Audit Trail Every automatic rule change (bidding formula, audience weightage, pricing logic) is logged with: Time stamp Pre and post-metrics (Sand box simulation with last 7 days data). Reason for change (proper justification). Human approver ID (if Human approval required). Example – Real-World Scenario During a festival sale, AI notices conversion rates drop 20% on social ads. It proposes to increase bids by +15% for high performing segments and reducing spend on low-ROI segments by –10%. A quick simulation shows expected ROAS improvement +7% in sandbox. Since the change falls within allowed limit of 10%, it auto deploys the change with time stamp. Later, fairness monitoring detects ads over targeting a single metro area (bias >20%). AI will freeze that ad segment and alerts compliance team about the detected bias. “Regional targeting bias detected awaiting review & Approval.” The marketing manager reviews the bias, approves for minor adjustments and restores the ad campaign. All events are logged for monthly audit. Summary This framework lets the AI learn and improve efficiently while staying: Statistically accountable (Performance Integrity) Ethically fair (Ethical Integrity) Strategically aligned (Business Alignment) The system gains agility without losing control proving that in digital marketing true “intelligence” is not about acting alone but improving responsibly within transparent, human-approved boundaries.
-
Domain: Maps & Navigation apps Process where AI makes regular decisions AI manages everything. Finding the shortest route to destination, predicting ETA based on google maps and historic data and showing you navigation / Direction on the map. Scenario (common, not rare) A main road is closed for repairs, traffic is diverted through side streets. A new flyover opens, but the map still thinks the old junction is the fastest path. Result: wrong routes, bad ETA’s and driver frustration. How the AI does a self-audit (detect bias, drift, declining accuracy) Route Reality Check (ETA drift) · Continuously compare predicted vs. actual travel times from live GPS traces. · If a segment’s error > 15% for 30+ minutes, flag it as suspect. o Likely causes: barricade/diversion/new signal/new flyover. o Keep monitoring if same delay is observed during peak and non peak hours then report this pattern. Flow Pattern Shift (data drift) · Detect sudden, sustained changes in speed profiles and turn behavior: o Many cars now avoid the old straight path and turn left / Right at a barricade → diversion from map guidance (not 1 but all vehicles). o Cars elevate then rejoin at a different point with higher average speed → flyover inferred. Report any such patterns. Map Confidence Score · For each road segment, keep a freshness score (last verified date + data volume updates of ETA). · Low freshness + high ETA error = “re-survey priority” (needs more data / crowd confirmation). Fairness / Coverage Bias · Check if errors are concentrated in periphery / new suburbs vs city centers. · If yes, schedule extra data collection (prompt drivers) to avoid “downtown bias.” What the AI must not change alone (needs human approval) · Permanent geometry edits of the road (closing / opening roads). · New flyover addition, lane direction changes, turn restrictions, Speed limits clocks. · These go to a map editor queue with evidence: o Heatmaps of turns, speed profiles, driver reports, photos (if available). Safeguards & boundaries (keep it responsible) No silent map edits: AI proposes; human GIS team approves. Audit trail: Every flag, ETA tweak, and approved edit is time-stamped and saved. Safety rule: Never route through pedestrian lanes/ Wrong route / private roads even if traffic flows do. Real time example (daily reality) Morning, 08:00: Barricades divert traffic off Main Rd to Side St. ETA error for Main Rd jumps to +25% to 40 minutes full day during both peak and off peak hours. 100% of vehicles turn left at the barricade → suspect diversion inferred. AI action (auto): Recompute ETAs with live speeds, recommend the diversion, Escalate the new finding. Evidence gathered: Turn heatmap + speed drop + user reports. Afternoon, 15:00: Human map editor reviews the evidence ands marks Main Rd “under repair,” adds official diversion. Two weeks later: New flyover opens. Cars now skip the old junction, elevation profiles & high speeds confirm. AI: Improves ETA instantly (auto), submits “flyover candidate” for human approval. Map team: Approves the new flyover geometry; routes stabilize, ETAs tighten.
-
Domain: Food Delivery / Ride-Hailing Operations How Should AI Recover Gracefully from Failure? In food delivery apps, AI manages everything. Finding a nearby driver, showing the shortest route for the driver, predicting delivery time based on google maps and historic data and keeping you updated live on the map. But in the real world, things go wrong: Drivers GPS signals drop during parking lots, traffic data goes missing or a driver’s phone temporarily loses internet. Failure Scenario (Happens Every Day) One Person order food at 8:15 PM. The food delivery app shows: “Your delivery partner is 8 minutes away from restaurant.” Halfway through, the food delivery partner enters an underground parking garage or a low-signal area. The GPS feed cuts out. The map freezes the driver icon doesn’t move and the ETA stays stuck at 8 minutes even after 15 minutes have passed. The customer starts worrying, the restaurant / customer keeps calling the driver and the system doesn’t realize it’s showing wrong information. This is a classic AI failure: the system keeps predicting based on missing or unreliable data. How the AI Should Handle It 1️⃣ Detect That It’s Blind AI should continuously check the location data is refreshed. If GPS updates is not received for more than 30 seconds, it must recognize: “I have lost tracking, my data is not in sync with reality.” 2️⃣ Communicate Transparently Instead of pretending in front of customer everything is fine, the app should tell the user: “We have temporarily lost live tracking for our delivery partner. Don’t worry your order is still on the way. We will update you as soon as the signal returns.” Transparency keeps customers trust. 3️⃣ Recover Gracefully Use the driver’s last known speed and route from app, to estimate approx current position. Update ETA using predicted travel time based on historic data instead of frozen data. Once the GPS reconnects, auto-correct the driver’s live location. If delay exceeds a set threshold, issue a small credit or apology notification: “Your order was delayed due to a signal issue, €3 credited as a token of apology for bearing with us.” 4️⃣ Learn From It AI logs every signal dropout / blank out location. If many dropouts happen in the same area, it switches to cell-tower or driver check-ins whenever that zone is detected next time. The Balance AI in delivery operations must be quick to realize when it’s blind, honest while fixing itself and smart enough to recover without drama. Even small mistakes hurt user confidence — but clear communication and rapid correction turn a failure into a moment of trust.
-
Domain: Massive Multiplayer Online Role-Playing Game (MMORPG) Development / Live-Ops and Gameplay Quality How Should AI Handle Uncertain or Incomplete Data? In online game operations, data is never perfect. Crash logs may go missing or never be reported by players. Logs from iOS and Android are sometimes unclear version details (10, 12, 21, etc.) may be missing, and regional network reports (EU / US servers) often conflict or the issue appears only on one server. Yet, AI systems are still expected to monitor gameplay, detect lag and protect the player experience in real time. At the same time, AI also supports longer-term gameplay balancing — tracking champion usage, win rates and game modes (like Dungeons or PvP Arenas) that players avoid. But this data is often incomplete or takes months to mature. For example, a “Legendary” champion showing only 1% global usage might indicate a deeper design issue — but AI cannot instantly know whether it’s due to poor skill synergy, long skill cooldowns, weak damage multipliers or simply player preference. This is where AI must clearly separate immediate technical reactions from long-term design evaluation. The Process: Live Event and Champion Monitoring During a live PvP event, AI detects lag or long matchmaking queues when players are ready and waiting to fight — especially during limited-time windows (e.g., 14:00–16:00). Meanwhile, over several months, AI observes that a few Legendary champions maintain <1% global pick rate. Two very different type of actions one demands instant technical action, the other requires patient data analysis & validated by human. How AI Should Handle It 1. Act Immediately on Minor Technical Issues even with broken / partial data When lag or performance drops are confirmed, AI can safely apply reversible fixes such as: Dynamically reducing graphics load during lag (e.g. from Ultra/High to Low). Adjusting frame-rate limits (e.g. from 60 FPS down to 30 FPS). Shifting players to alternate regional servers to reduce matchmaking delay during time-bound PvP events. Performing server load balancing or rerouting traffic between servers within the region or cloud regions when waiting time crosses a threshold. Censoring offensive words in chat automatically (F***, S****d) when AI is uncertain but suspects potentially inappropriate language. Restarting a regional server when it stops responding. Re-syncing user progress when save-data upload fails. These actions are real-time, safe and reversible they restore gameplay smoothly without waiting for human input. 2. Observe, Don’t React on Long-Term Trends Champions balancing (Buffs/Nerfs) must never be adjusted automatically by AI. AI should continue gathering trend data across events, servers (EU/US servers) and player tiers (New / Mig Game / Eng Game) before flagging persistent underuse or overpowering for manual review. Example insight: “Legendary champions <1% usage globally over 3 Months.” Automatically nerfing or buffing based on partial data risks major backlash from players. Some players (“Whales”) may spend thousands of euros monthly and invest heavily in a Legendary champion and get them through RNG shard systems, so sudden AI-driven uncontrolled changes to champions could cause frustration and loss of trust. 3. Escalate for Human Decision-Making When trends are identified, AI should summarize findings and escalate to design or QA teams for testing and controlled rebalancing. If a champion becomes overpowered or bugged (e.g., one-shot kill any boss) after champion re-balancing, AI must flag and communicate it immediately in-game so players are informed that the issue will be fixed soon avoiding players wasted spending ( Real Money ) on bugged content. Escalate it to developer as AI can monitor such data in live server. It can check all type of reactions like particular champions skill interactions (Buffs / DE Buffs) Cheating and Bot Mitigation (Pattern-Based) For repeatable abnormal patterns — such as impossible damage numbers or automated click intervals — AI can act instantly to: Flag suspicious accounts. Freeze rewards or invalidate match results pending audit. This ensures fairness without affecting normal players. AI can also recommend merging low-population servers to reduce matchmaking delays in future live PvP events.
-
Domain: Quality Assurance in Manufacturing How Confident Should AI Be Before It Acts? In a Quality Department confidence level is not about a percentage threshold (>80% GO / <80 % NOGO) but it is about risk, reversibility and responsibility. AI is now embedded in many day to day QA activities, from in-line inspection and NCR tracking to critical suppliers performance monitoring. While final accountability stays with humans, AI can make informed decisions in defined, low-risk zones that help speed up the process without compromising integrity. The Process: In-Process Inspection and Defect Flagging In the shop floor, AI integrated laser 3D scanners detect surface marks, scratches or stains. Here is how it plays out: For critical sealing surfaces or safety features, even if AI detects a high probability of defect. It should only alert and hold the parts, never proceed to reject or scrap. QA must validate before taking any actions. For example, AI integrated laser 3D scanner may flag a White patch mark under 20X magnification. Is the white patch below or above the coating surface. Rejection criterion is “Visible to the naked eye not 20X magnification” and “fluorescent under UV light in dark room” only QA can check and decide. No matter how much confidence % based on co-relation to historic data, AI should not decide. AI’s confidence is information — not authority. It only raises alarm, will not pull the plug. For non-functional or cosmetic areas if the detection system has proven reliable over time, AI can auto-tag parts for recheck or rework and allow the line to continue. These are safe, reversible decisions where AI genuinely adds value. When Can AI Decide on Its Own? AI should act automatically only in areas where: The risk is minimal :- e.g., non-functional cosmetic issues or repetitive, well-understood defects. E.g Dent upto 1 x 1 mm in 10CM2 is permitted. If laser scanner measures this and is with in the acceptance limit, Then AI can decide to accept by saving the pictures for future reference. The action is reversible :- such as routing a part for re-inspection or initiating re-measurement. The decision is data driven and routine — for example: Auto-adjusting sampling plans when process stability is proven. Triggering calibration reminders when measurement drift from mean is detected. Flagging repeated rejection to tighten incoming checks and supplier outgoing inspection. These are operational support decisions, not customer-impacting ones. They save time, reduce fatigue, and allow engineers to focus on complex, judgment-based issues. The Balance AI should be trusted to act where it can’t harm and required to ask where it can harm. It can manage data, spot deviations and trigger safe, reversible actions — but the moment a decision touches safety, customer experience or compliance. The final say belongs to humans, That’s the real balance: AI ensures speed and consistency, humans ensure wisdom and accountability. Together, they create a Quality system that is fast, reliable and deeply human at its core.
-
Domain Selected :- Quality Assurance in Manufacturing How Much Should AI Explain Its Decisions? In Quality, trust comes from understanding why a decision was made. AI now supports critical functions like internal non-conformance handling, customer complaints handling, explanation levels must match the audience. Too little information creates doubt and Too much creates unnecessary confusion. The right balance depends on risk, audience and impact. Process: Non-Conformance Handling & Customer Complaints In our manufacturing process, AI reviews NCR data, tool change logs and past dispositions to suggest the next step — for example: “Defect matches 91% similarity with PN-1072. Likely cause: tool wear after 12 hrs. Past disposition: rework; success rate = 85%.” That’s useful, but each level in the organization needs a different depth of explanation to act confidently without being overloaded. How Much and in What Form 1️⃣ Operators & Inspectors – Quick Clarity They need to act fast, not analyze data. AI should show: Recommendation: “Rework suggested.” Confidence: 82% Top factor: “Tool beyond set life.” Visual clue: 🟢🟠🔴 traffic-light status. Simple, direct, and actionable — no background theory. 2️⃣ QA Engineers – Complaint RCA & Structured Rationale QA Engineers validate AI decisions so they need reasoning, not just raw data / rework decision. AI should provide: Key co-relatable variables (tool wear, Tool life not monitored, coolant flow, setup change) Top three likely causes with probabilities (basis historic data from NCR data base) Linked past NCRs and results It should explain like a junior engineer: factual, logical and concise. 3️⃣ Auditors / Customers – Full Traceability For customer complaints or external audit cases, explanations must show back up evidence and accountability: Root cause Analysis flow (“Tool wear → setup drift → scratch”) Parameter trends and charts. Confidence range and risk level This builds external trust and transparency. 4️⃣ Top Management – Strategic Insight Executives do not need micro level data; they need impact and direction. AI should present summarized aggregated insights for review such as: KPI dashboards: On-Time Customer Complaint Containment actions %, on-time Complaint RCA closure cycle time %, Customer complaints trend, Cost Of Poor Quality (COPQ) trend and supplier PPM. Root cause Buckets: “In-correct Assembly 28% | Parts Missing / Wrong part used 17% | Wrong Labelling 12%”. Forecasts: “If trend continues, Customer ‘B’ PPM may breach target by Week 46.” This level tells leadership what matters: risk, cost, and customer trust — not algorithm details. Drawing the Line: Clarity vs. Overload Audience Format Detail Purpose Operator / Inspector Summary + Confidence Level Low Act quickly QA Engineer Rationale + Evidence Medium Validate logic Auditor / Customer Full traceability High Justify decisions Top Management KPI + Risk summary Strategic Guide decisions AI must explain just enough for taking informed action, not too much that user drowns in data. The Balance AI should communicate decisions like a skilled engineer: What it recommends, Why it believes so, How sure it is and What evidence supports it. Beyond that, detail becomes distraction. When AI explains its reasoning at the right depth for each level — from the shop floor to the boardroom — it builds confidence, speedy decisions and turns data into trust.
-
Domine Chosen - Quality Assurance in Manufacturing How Should AI Decide When Two Good Goals Conflict? In manufacturing, AI often works in environments where both objectives are right — but they clash. The Quality Department wants zero defects and compliance. Production wants continuous flow and on-time delivery. Supplier Quality wants stable cost and lead time. Each goal is valid — but AI must learn how to prioritize them intelligently, not blindly. Process 1: Production Throughput vs. Quality Compliance This is the most common conflict in any factory. Production says, “The parts look fine — don’t stop the line.” Quality says, “It’s a critical surface — we can’t take that risk.” AI sits in the middle, monitoring data from in-process inspections, sensors and rejection trends (as it has access to ERP parts produced so far, Shipped so far & rejection details). How AI should decide: AI should never “choose sides.” Instead, it should base its decision on risk severity and customer impact: If the deviation affects a functional (sealing surface) or safety-critical feature (CTQ / KC), AI must side with Quality — hold the batch, flag the risk and recommend containment (stock purge / Hold shipment). If the issue is cosmetic or within statistical control limits, AI can side with production — allow continuation but tag the lot for recheck or deviation (DN) approval. AI’s role is to translate emotion into evidence. It provides data-backed probabilities like: “Risk of customer rejection (particular part FPY / Rejection rate): rework delay: 6 hours; potential cost impact: €2,000 approx.” Human oversight: Quality and Production jointly review AI’s assessment. If the risk is real, Quality leads containment (block shipment, stock purge). If not, Production proceeds under controlled deviation (DN). The final authority stays human, because accountability and customer trust can’t be delegated to an algorithm. One bad batch delivered & PPM KPI goes to Toss. Process 2: Supplier Quality — Delivery Lead Time vs Cost vs Consistency AI may detect that a particular supplier’s rejection rate has increased and recommend re-sourcing to improve quality metrics. But humans know the bigger picture, In few cases sources are customer defined (E.g. Raw Material from fixed mills / Special process processing at fixed suppliers). You do not much room to change source or switching suppliers. Also keep in mind it may take 6 – 8 weeks of lead time and higher cost to find a new supplier. which might hurt delivery commitments. How AI should decide: It should weigh all three factors Quality trend, response speed and commercial impact rather than looking only at defect percentage. If supplier is improving and meeting agreed timelines, AI should suggest continued collaboration with close monitoring on performance. If they are repeatedly failing to meet deliveries or rejection rate increases, AI can recommend escalation to HOD. Human oversight: Supplier Quality Engineers (SQE) validate this by performing on-site QMS audits, GEMBA Walks, noticing the communication tone (actions speak better than words) and trust history (honoring the commitments) AI cannot read these. This ensures decisions taken balances both lead time, cost and quality, not one at the expense of other. Process 3: Customer Complaint Handling — Speed vs Depth When a new customer complaint is received, AI instantly block related parts in ERP and tracks response time. That helps in stopping the bleeding (close the tap) and meet SLA targets like 48-hour containment. But too much speed risks quality of investigation (addressing the symptoms instead of root cause). How AI should decide: For high-risk or repeated complaints, AI should recommend deeper root cause analysis with human validation (AI has access to internal rejection data & RCA). AI can also check if a particular Work center Is causing more issues. In our ERP we have a grouping of all the parts (bellows / Purge Hood etc) so if we accepted complaint on one part of this group. AI also shows similar parts in the group. So human can check if same actions need to be horizontally deployed in the other parts from the family. Human oversight: Engineers review AI recommendations, if it fits the customer expectation and past complaint history. Example same complaint could have been received in the other part from same family. This keeps speed and depth in balance. Horizontal deployment is very important aspect during customer complaint handling which several times is overlooked by QAE. If we deploy the same corrective actions in similar family parts then repeated type of customer complaints will come down drastically. The Human Role in the Balance AI should prioritize using risk - based logic, but it must always flag uncertainty for human review. Humans set the boundaries as per specification requirement (Drawings / standards), interpret customer expectations and carry responsibility for outcomes. AI brings objectivity humans bring judgment. Together, they turn conflicts between speed and accuracy, cost and quality, production and compliance into balanced, data-informed decisions that protect both the customer and the company’s integrity.
-
In our department Quality Assurance in manufacturing one of the most important processes what we call as Complaint to Correction (C2C). It starts when a customer complaint is received and ends when the problem is fully corrected in production process. Here both AI and humans can learn a lot from each other. Where AI should Learn from Humans AI can read data but it does not understand customer expectations or product function requirement the way a quality engineer does. That is where it needs to learn from people. Understanding the “Why” behind decisions When a QA engineer decides whether a defect part can be reworked / DN raised or must be scrapped, they look at things AI can not ex:- whether the defect is on a sealing surface. How strict that customer or specification is or if it’s a approved deviation is one-time conditionally accepted. If we record those reasons clearly, AI can start recognizing similar situations and give better suggestions next time. Learning Root Cause Patterns Engineers often find the real reason behind a failure maybe a worn tool, wrong setup, missed Tool Life Monitoring or handling issue. When AI studies those final root cause reports, it learns to connect machine data (setup change / Tool Life Monitoring) or process changes with real defects. Customer Sensitivity AI should also learn, how different customers react and what different customer specification permit for each defect. Some accept small cosmetic defects, others reject even minor ones. By learning from our past decisions, AI can predict customer reactions more accurately. Where Humans Should Learn From AI While AI cannot see every detail on the shop floor, it can process massive amounts of data that we might miss. Spotting Early Warnings AI can analyze NCR’s and say “This same scratch issue happened right after a tool change last month.” That helps quality engineers act early before the same issue reaches the customer again. Keeping Us on Track AI can monitor complaint timelines 48 hour containment, 4 - day RCA for L1 complaint issues and remind or escalate when deadlines are at risk. This informs the team to be more disciplined and prevent any delays effecting the KPI. Showing Useful Trends AI can highlight patterns like “80% of similar cases were successfully reworked.” That helps new engineers make quicker, more confident decisions using real data. The Learning Loop Here is how this partnership works in practice: AI helps by blocking the shipment in ERP when NCR is registered for a particular WO, checking for recurring issues and reminding teams about complaint timelines (Containments action, RCA, CA & PA). Humans step in to inspect the parts, measure the cosmetic defect (length, Width & Depth) decide the real root cause and choose the right corrective actions based on drawings and customer needs. The decision and reasoning are saved in the system. AI then learns from that for future cases. Next time, AI gives smarter recommendations and engineers make faster, data driven decisions. Over time, both get better. The Result This shared learning loop reduces delays, prevents repeat complaints and keeps us compliant with customer KPI’s. RCA cycle time & PPM. AI brings the speed and data based decisions, humans bring experience based judgment and customer understanding. When both AI & QA learn from each other, the result is a stronger, more proactive quality processes and not just reacting to problems, but preventing them before they happen.
-
Yes AI can ensure compliance in Customer Complaints in manufacturing to Proactive monitor & meet customer KPI’s In our QA workflow AI is be embedded to help control deviations and hold shipments. Here is how it fits into our daily operations. 1. Containment Actions Compliance Every day, we extract complaints from the customer portal. When a new complaint is logged, AI can automatically block the related part number in the ERP system. This ensures no further shipments happen until QA checks the stock and WIP. Once QA confirms stock & WIP is okay, the part number is unblocked. This step ensures containment actions are taken with 48 Hrs as per 8D immediately, without relying sending emails & follow-ups. 2. RCA Cycle Time Monitoring Once complaint part is received back from the customer and updated in Portal, AI starts tracking the RCA cycle time: Generates NCR from customer portal dump, separate the L1 & regular complaints from NCR data base. For L1 complaints if the RCA is not submitted in the portal with in 4 calendar days, AI send escalation mail to the Head of Department (HOD). For all other complaints, if the RCA is not submitted in the portal with in 18 calendar days, AI send escalation mail to the Head of Department (HOD). This Ensures RCA cycle time is in check and ensures that delays are caught early. 3. Corrective Actions Locking When a complaint is marked as “Accepted,” in NCR data base. AI locks the release of new work orders for that part number. The lock stays in place until QA confirms that all corrective actions have been implemented and officially released in ERP. This prevents recurrence and ensures that no new production starts until the root cause has been addressed properly. This approach helps QA teams stay ahead of compliance risks, meet KPIs, and reduce manual oversight all while keeping control in the hands of the engineers.
-
AEIOU is essentially a Framework to structure all observations you make on the field mostly used during user research. AEIOU stands for Activities, Environments, Interactions, Objects, and Users. Activities are goal-directed sets of actions. Who are the people, what is the work &/or specific activities and processes they go through to get the results. Environments include the entire area of where activities take place. What is the function of each individual spaces. Interactions are between a person and / or someone or something else; they are the building blocks of activities. What is the nature special interactions between people / objects in their environment. Objects are building blocks of the environment, capturing all the key elements in a process. What are the objects and devices in their environments and how do they relate to their performed activities? Users are the people whose behaviors or process are being observed. Who? What is roles and relationships? Example A = Activities. Developing on 3D Printing parameters for 0.5MM layer thickness. E = Environments. Inert gas in chamber while printing with contact 5 bar pressure I = Interactions. EOS 400 Machine, IN718 powder O = Objects. Additional supports provided for supporting hangover of parts. Steel re-coater used. U = Users. Oxygen, Nitrogen & Hydrogen were in control as per defined specification if IN718 powder.
-
Project Charter BOSCORD Definition:- A project charter is a formal document mostly from Top Management that authorizes the project managers to execute a particular project. It officially states that they can work with their team to utilize company resources, such as people, technology and finances, to complete the project, from start to finish. BOSCARD offers a structured approach to define and plan a project. It helps as a tool used to give terms of reference when defining a project management frame work. It is not entirely clear where this tool originated. Some believe the model originated from cap Gemini the 1980s. Elements of Projector Charter A. Business Case: Explains why this project is needs to be done now. B. Opportunity Statement or Problem Statement: Explains the opportunity or the problem currently faced, where do we stand. C. Goal Statement: Defines deliverable of the project D. Project Scope: Defines the project scope. E. Define Budget: Decides if this project is really needed or it will be like speeding 1000$ for 30$ gain. F. Project Plan: Timeline for all the phases of the project to be completed G. Team Selection: Team members are defined and responsibilities assigned. BOSCARD stands for: a. Background :- Tell about the history of the problem b. Objectives :- Goal of this project (SMART) c. Scope :- Borders of the project d. Constraints :- Limitation or restrictions (Budget / Timeline) e. Assumptions :- Consideration of Key resources (Supplier), Technical Feasibility. f. Risks :- Technical, Resource, Planning, Critical part. g. Deliverables :- SOP / Reports / Tangible / Non Tangible. It provides clarity to everyone especially Top Management about what is expected as output to be accomplished. It establishes expectations to stakeholders and ensures everyone will be working towards the same goal. Used in defining essential terms for reference (Who, why, what, where, when, How)
-
In order to understand this question first we need to understand where this Pareto originated from. A Famous Italian economist named Vilfredo Pareto stated the Pareto principal when he observed that top 20% of population of his country are holding approximately 80% to total wealth (Vital Few, Trivial many). Later this concept was widely used in Quality Control when they observed defects also follow similar pattern as stated by pareto principal. Few problems leading to several parts rejections. Commonly referred as 80/20 rule is just a representation. So cases can be 90/10 and some may follow 70/30. The concept its still the same the small amount of population is holding large amount of wealth. Example See below graph after seeing this you can decide, what should be your first priority to work on. Small amount of problems are causing larger rejections. Pareto chart will give us what should we concentrate more on to get the rejections under control.

-
May be in olden days this statement would have been true, "Process Improvements do not result in specification change". In todays modern world, where we see new innovation left and right on every corner, not one but there are several such example where specification limits were changed. Examples 1. Earlier if customer needed a spherically hollow part with say 3mm thickness, they shared drawings with 2 'C' type parts which get welded and then become sphere. Now with innovation in metal 3D Printing, with little changes full Spherical parts will be 3D Printed. Now Specification Limit (drawing) changed completely, as a single solid part. In My Previous Organization we printed such a part for a defense customer. 2. Earlier if you need a Burger after ordering we used to get in like 15-20 Minutes. Now with Innovation by KFC & Mc Donald's they deliver within 5 min. Now Customer specification (expectation) changed, We need Burger with in 5 Min of order. 3. Earlier for booking a cab we need to inform well in advance in 2 days or 1 week that we need a car on so and so date. Now after innovation by Uber and Ola, The movement you decided you need a car, you can get it in 5-10 minutes of wait. Decided to change the destination no worries go ahead, Customer specification limit (expectation) changed now. 4. Earlier when you order grocery online / Food Items in initial days they used to take like 4-5 Hours. Now with innovation in delivery apps, In 30 Minutes you will get your food items and grocery (Zomato, Swiggy). 5. When Dominos said "Delivery in 30 minutes or free" then specification limit for delivery time changed. 6. Earlier if you buy any items online or in showroom there was no refund option. Now after innovation by Amazon and Flipcart in supply chain they guarantee 30days refund guarantee Customer specification limit (expectation) changed. Now almost for all the products you have return policy if you do not like it. 7. Earlier for Mobiles there was not even 2GB storage capacity. After innovation by Iphone, Samsung, Nokia and now Customer specification limit (expectation) changed its 128, 256, 512GB. For Ram as well Customer specification limit (expectation) changed 16GB ram for Mobile is no longer fancy its a new specification for some customers. 8. Mobile internet speed, Earlier for Mobiles specification was 2G then it changed to 3G later 4G and currently 5G. 9. Earlier Laptop users were looking for 256GB hard disk and now Customer specification limit (expectation) changed 1TB and 2TB is like minimum need now, same also goes for Ram of laptop. 10. Sports cars when they initially stated speed was as far as what I remember it was somewhere around 150 KM/Hour. Now Customer specification limit (expectation) changed 304.7 MP is the new fastest speed for sports car. Summary All the innovations that happened in one company have become a norm in that particular sector / Industry. So ya customer specification has been changed and same were expected from other competitor suppliers, as on when a new innovation happened.
-
Hi In Forum score board screen, it states we can get points by below means(Refer snaps shot). what is this just for understanding is there a way we can earn these points. I do not remember seeing this any where in forum.

-
Can there be a process step where RPN = 1? Let us first understand how RPN is calucated. RPN = Risk Priority Number can be calculated by Formulae, Severity (S) X Occurrence (O) X Detection (D). Inorder for RPN to be 1 all Severity, Occurence & Detection must be one. Let us take a example to see if this is possible. Example Severity For Severity to be 1 there should not be any discernible effect, I have worked with Aircraft cabin structural drawings, there will not be any dimension which will not have a impact on the Fit, Form, Functions (rating 5-8) or actetic aspect(Rating 2-4) of the part, so having a severity of 1 which is no effect at all, its pretty rare. However theoratically speaking any reference dimension in drawing can have a severity of 1, So Severity = 1 [Reference Dimension example As per ASME Y14.5] Severity = 1 Occurrence For Occurrence to be 1 it should be 0 PPM, You may think of introducing Poke Yoke to get this, Firstly it is not possible to have Poke Yoke in all the cases, Secondly Poke yoke implementation is costly. Thirdly it makes no sense in introdusing Poke Yoke for every non critical dimension. Occurence can have 1 if you have Poke Yoke. Example :- Manual Tig Welding fixture can have poke yoke to prevent end fitting incorrect orienatation. Occurence = 1 Detection For Detection to be 1 you can have Poke Yoke in inspection fixture, again poke yoke is not always possible. For non critical items any visual or dimensional inspection will be adequate. Yes Detection can be one if Poke Yoke can be introduced. Example :- Inspection fixture can have poke yoke blocks / Pins to prevent part seating if end fitting incorrect orienated. Detection = 1 Summary Theoratically speaking yes its possible, if you have met criteria provided above RPN can be 1. Pratically RPN cannot be 1 as there will always be a impact for any dimension non conformance, introduction of Poke Yoke is not always feasible for Occurence and Detection, even is possible this may not make a business case to do something like that when simple dimentional inspection can suffice (Over processing).

-
Regression analysis is used to describe relationship between a set of independent variables and the dependent variables. R squared (R2) is generally defined as statistic that indicate % of Variance in dependent variable that the independent Variable could explain collectively. R Square evaluates the scatter of the data points around the fitted regression. It is mostly referred as Coefficient of determination. Example Let us say there are 6 ingredients (X) used to finally make a tasty dish (Y). R square will help to determine which ingredient has more impact on the final taste of the dish(Y). We need to see which ingredient has more impact on final taste of dish. Salt R2 15% Spices R2 35% Pepper R2 10% Tomato R2 20% Onion R2 20% Color Powder R2 is 0% Looking at R2 of all the ingredients (X) it Indicating spices have a higher impact on the taste of the dish (Y) & Color Powder has no impact on the final taste of the dish. Lets see one more example to see what it means when R square is 0. (Advertisement Vs Sales of Umbrellas) Interesting thing to note here that when R square is zero the line becomes horizontally indicating you cannot in any way predict out put Y with respect to input X. As they have no correlation. Lets see what it means when input (X) has some impact on the Output (Y) (Rainfall Vs Sales of Umbrellas) R-squared may seems like an easy to understand statistic that indicates how well a regression model fits a data set. However, it does not tell us the complete story. To get the full picture, you must consider R square values in combination with the residual plots refer above image.


-
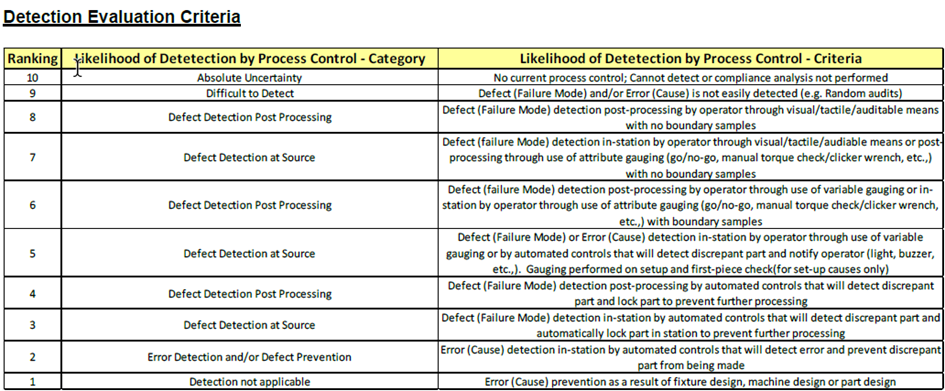
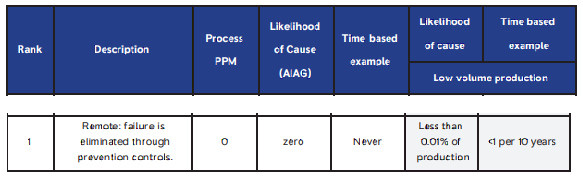
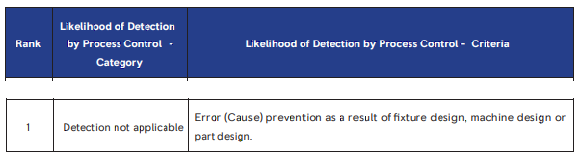
Failure Mode and Effects Analysis (FMEA) is the most effective of all the Defect Prevention tools in my opinion, for achieving zero defects. If done correctly and with the right attention to detail it will enable the organisation to design products and / or processes that meet the customer’s requirements at optimal cost. However, it can also be the most difficult to deploy as it relies not only on technical knowledge and experience but precision to right level of detail. If done poorly it will take a lot of resource for very little benefit and runs the risk of organisations , it is better to not to do it at all than just doing it like a form filling exercise. Risk Priority Number (RPN) Risk Priority Number (RPN) can be calculated for each Potential Cause of a particular Failure Mode. The calculation is quite simple. RPN = Severity x Occurrence x Detection Criteria’s of Severity, Occurrence & Detection varies for DFMEA & PFMEA in Aerospace Industry. For this example let us consider only PFMEA related criteria. Severity Severity defines what will the impact incase of failure of that characteristic. Inputs for severity 1. From DFMEA 2. Critical / Significant / product KC in drawing 3. Process Key Characteristics (KC) Occurrence The occurrence rating looks to evaluate the potential for the Potential Cause of Failure to Occur in our current existing process. This is done on a scale of 1 to 10 where 10 is ‘will happen nearly always’ and 1 is ‘will never / unlikely to happen’. Criteria is based on, How many times per million opportunities would we expect to see the defect (PPM), Likelihood of the Potential Cause occurring or how often have we seen this type of defect (time-based examples). Inputs for Occurence 1. Customer escapes 2. Internal Rejection % 3. Capability Indices (CP,CPK,PP,PPK) 4. PPM Detection If the Potential Failure Mode did occur how confident are we that we would detect it before it was dispatched to the Customer? Answer to this question will give us the Detection score. Inputs for Detection 1. Inspection Plan 2. Process Flow (rating changes depending on where you are inspecting) Could there be a process step, where the RPN is 1000? Yes there could be such a process step, see below stated example. When the stated characteristic is a critical dimension where failure of that feature can result in harm to person without any warning. (e.g Telephone blasting or catching fire during charging without any warning , Aeroengine welded pipe suddenly blasts due to crack and causes engine failure in running condition). Severity = 10 When there is high chance of getting the defect in almost every part. (e.g Porosity / internal crack during welding of tubes if its 100% probability in all the parts). Occurrence = 10 You are doing inspection and if a particular defect cannot be detected at all in your inspection. (e.g Micro Porosity or micro crack after welding cannot be seen by naked eye, but you are doing visual inspection). Detection = 10 In this case RPN will be = S x O x D = 10x10x10 = 1000 Boeing 737 Max grounded example e.g MCAS Characteristic Severity :- MCAS system was a critical feature, but it had a single point of failure. it auto changes the direction of the plane without any warning, which let to loss of several lives (Severity 10). Occurrence :- This could have happened to all the planes as it had a single point of failure for a critical feature, secondly it was located at the outer side where "bird strike" had a very high chance. Thirdly the reaction time for pilot to turn of the MCAS, once if the MCAS is triggered is 15 seconds. (Occurrence = 10) Detection :- Even if the Pilot tries to turn off the MCAS within 15sec and take it to manual control, because of the MCAS sensor failure the software auto corrects the plane movement downwards, Even pilot is clueless why. (Detection = 10) In this case RPN will be = S x O x D = 10x10x10 = 1000